A “double-layered” Moon Dog (paraselene) display captured precisely at the moment of the moon’s Last Quarter phase (48.5% illumination). The image was taken at UTC 2026-09-03 22:01 (00:01 local time, Sept 4) in Ørsta, Norway.
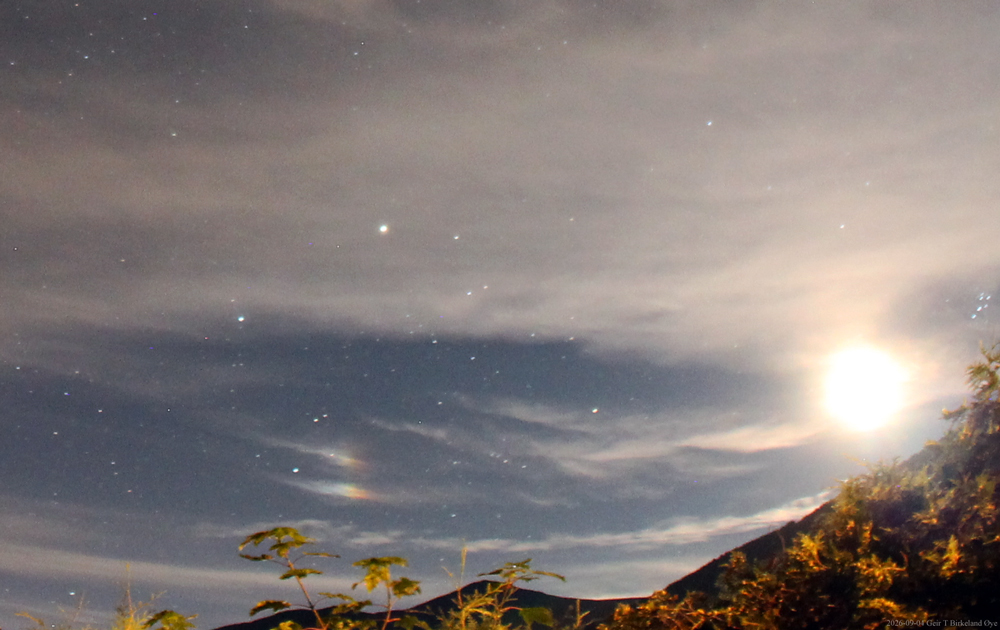
A “double-layered” Moon Dog (paraselene) display captured precisely at the moment of the moon’s Last Quarter phase (48.5% illumination). The image was taken at UTC 2026-09-03 22:01 (00:01 local time, Sept 4) in Ørsta, Norway.
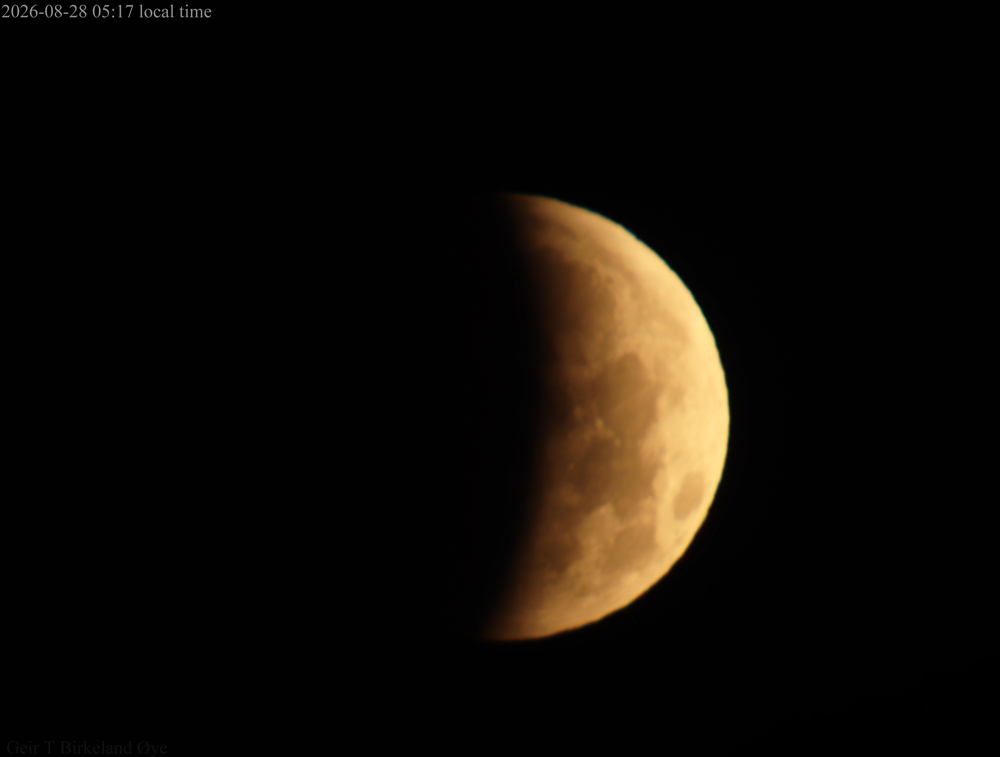
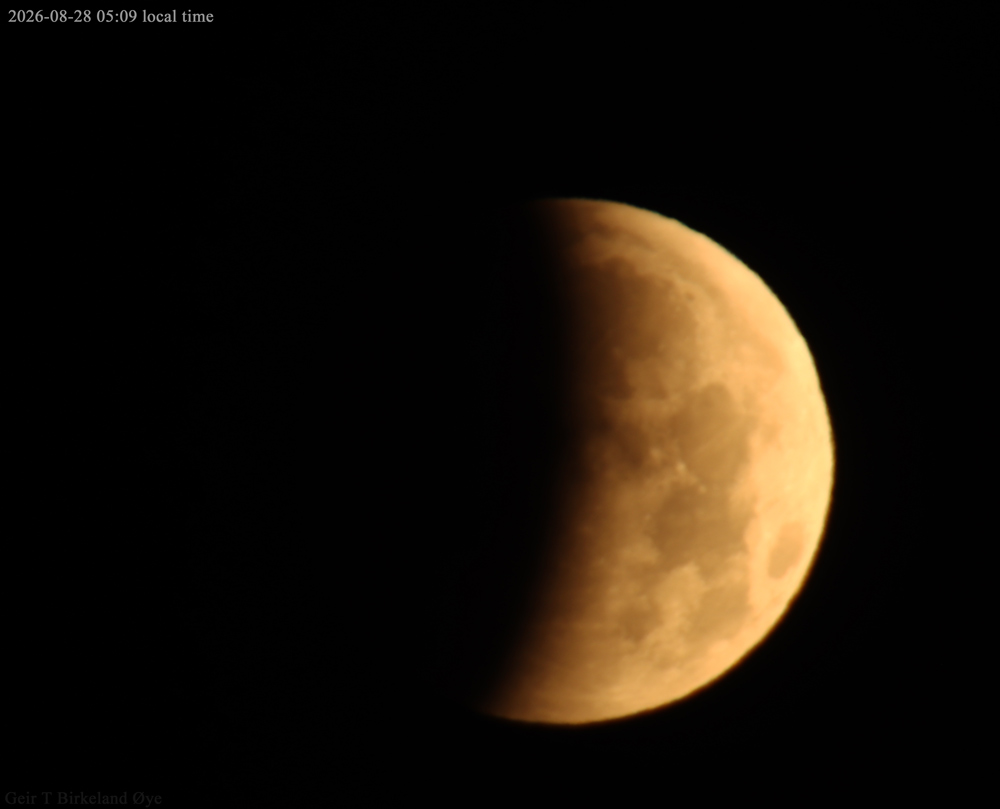
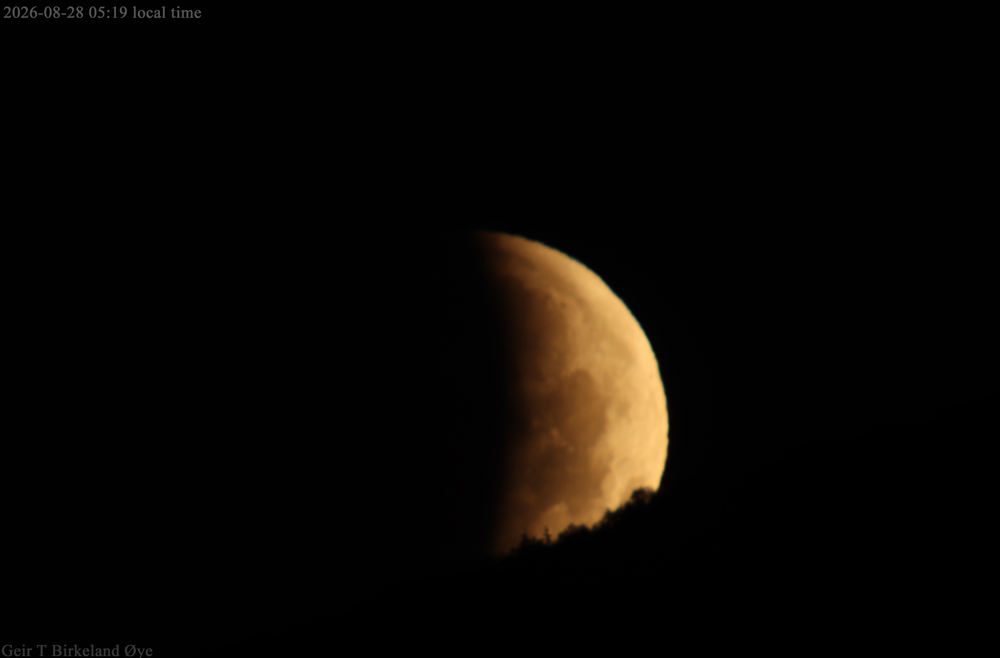
It is always fascinating to see the Earth’s shadow darken the lunar disk. This time the Moon was very low and the sight was obstructed by the terrain. The Moon went behind the mountain at about 05:21 local time. Before the partial eclipse was at its maximum. Here are a few images of the display. Location: Ørsta, Norway. Details: Canon 800D, Sigma 50-500mm lens, 2x converter.
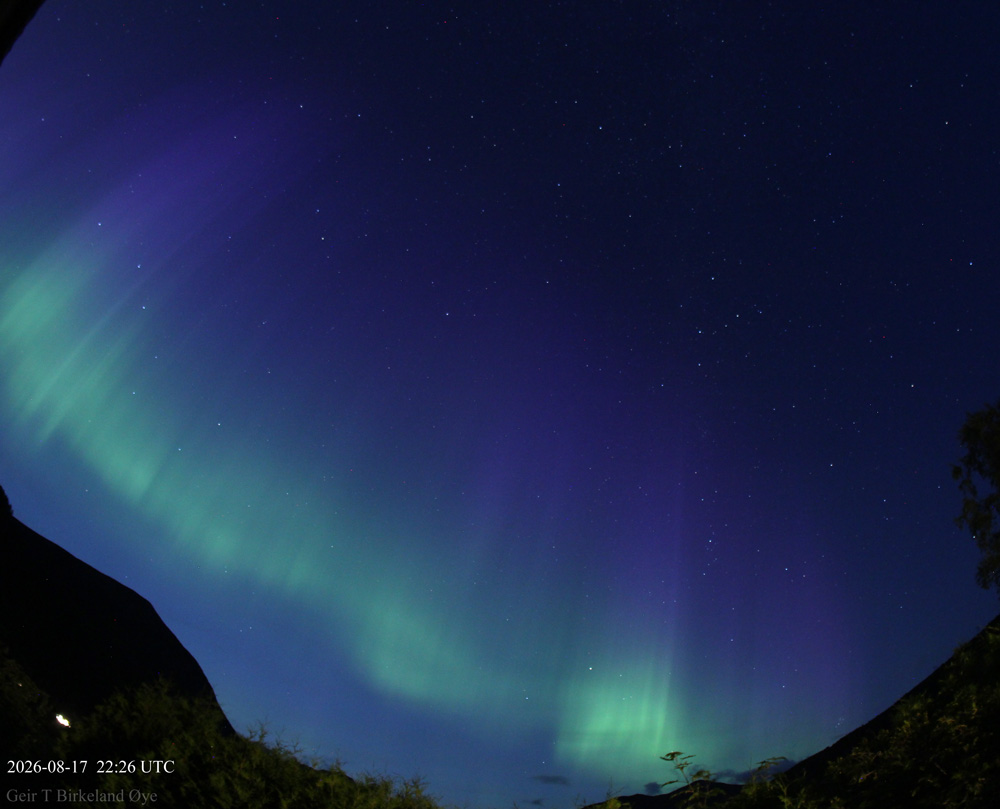
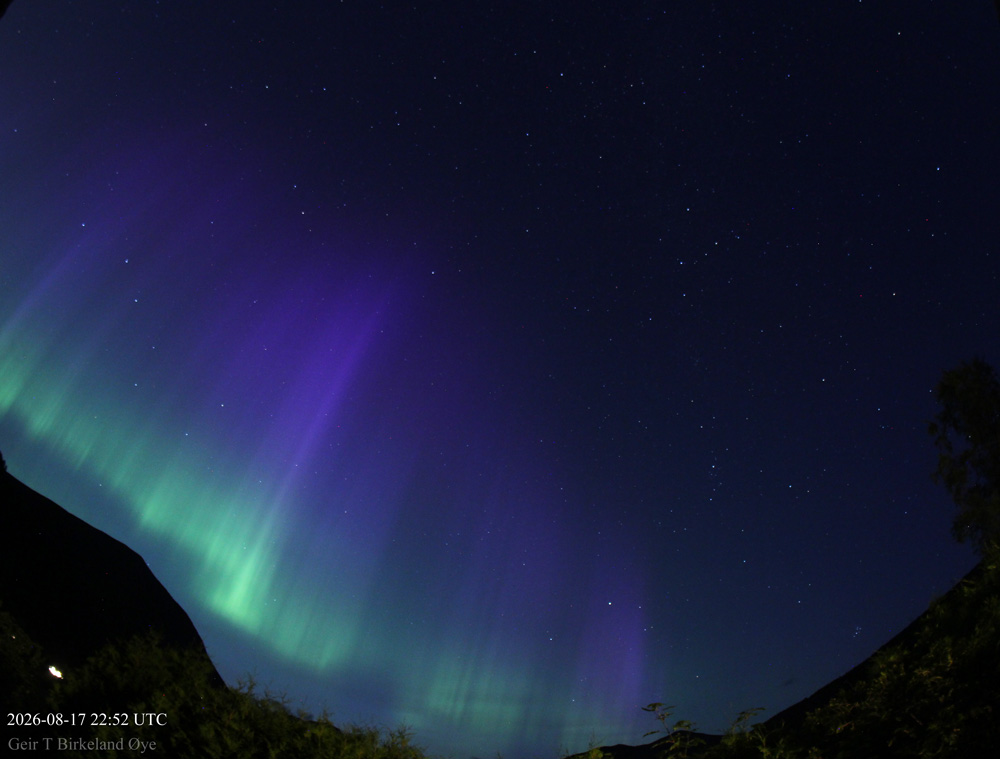
A couple of images of the aurora borealis on August 17/18, 2026, as seen from 62° N. Details: Canon 650D, 8mm fisheye lens, ISO 800. Timestamps are on the images. Location: Ørsta, Norway
RAGDA – Auroral Dunes A sequence of auroral activity was photographed over Ørsta. The evening began with a RAGDA‑type green arc, followed by a southern auroral band, and later long, parallel light bands consistent with auroral dunes. Timeline of images (local time, but time is UTC on images) 22:03 – RAGDA‑like green arc low in the sky 22:52 – green patch 23:03 – first thin parallel stripes 23:06 – clearer stripes; brighter aurora above 23:40 – distinct banded pattern 23:42 – strong, well‑defined parallel bands (auroral dunes) 23:46 – weaker but still visible banded structure 00:00 – final faint stripes before fading Notes: Parallel banding visible from 23:03 to 00:00. Eight images covering the full progression.
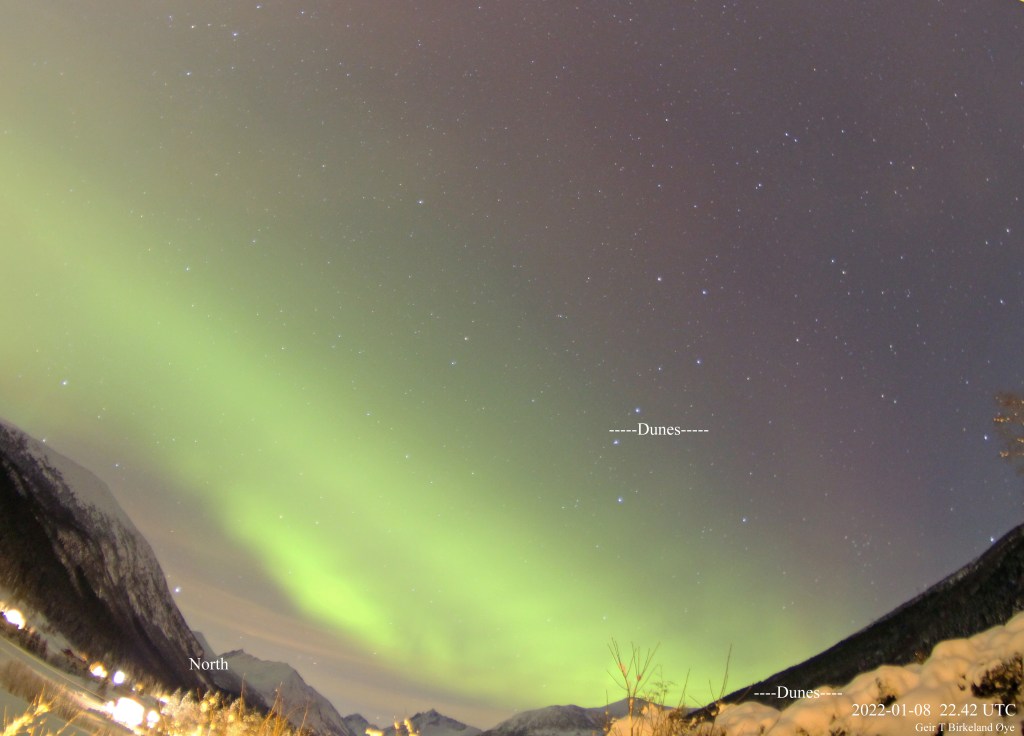
Local time: 23:42 – strong, well‑defined parallel bands (auroral dunes)
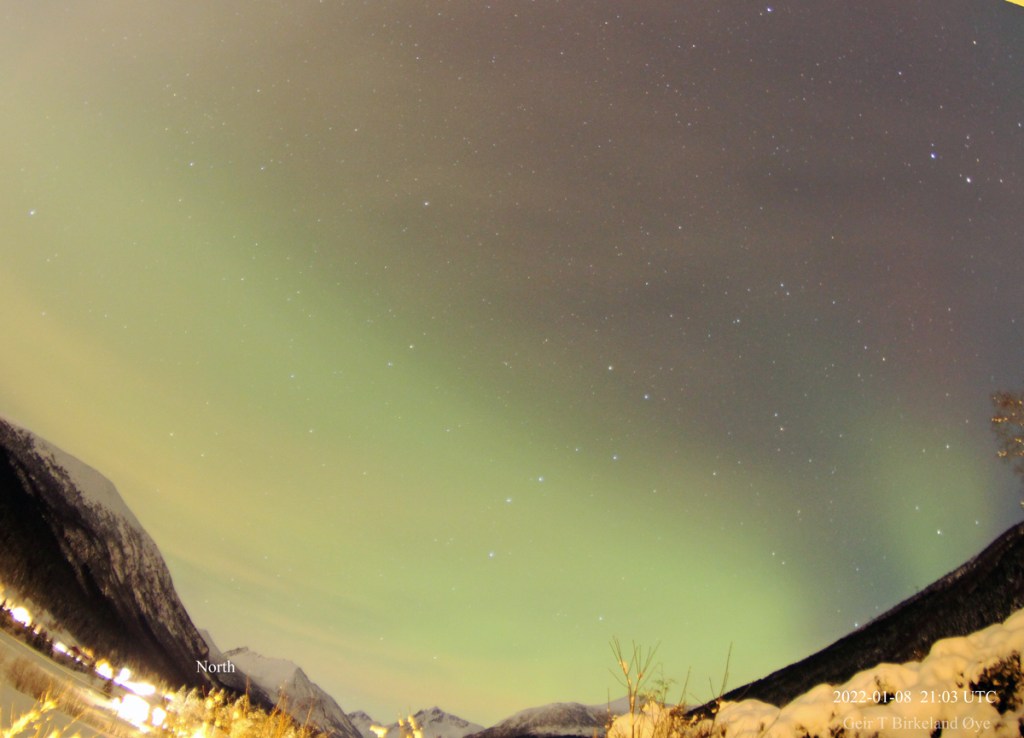
Local time: 22:03 – RAGDA‑like green arc
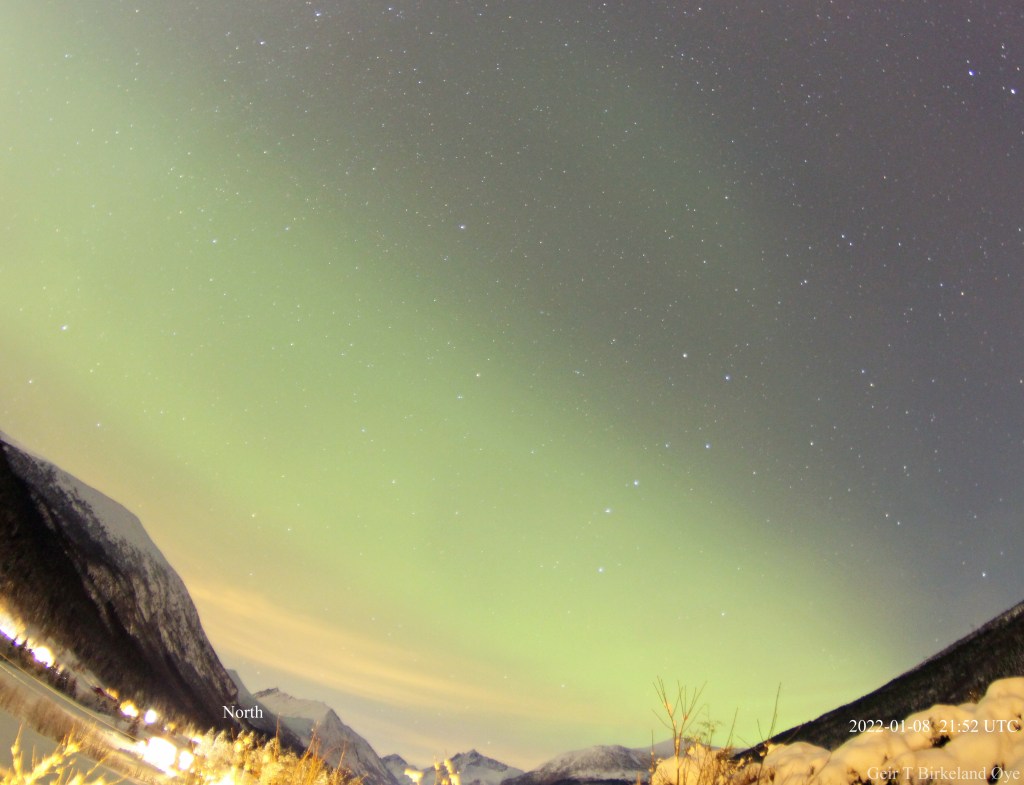
Local time: 22:52 – green (proton) patch
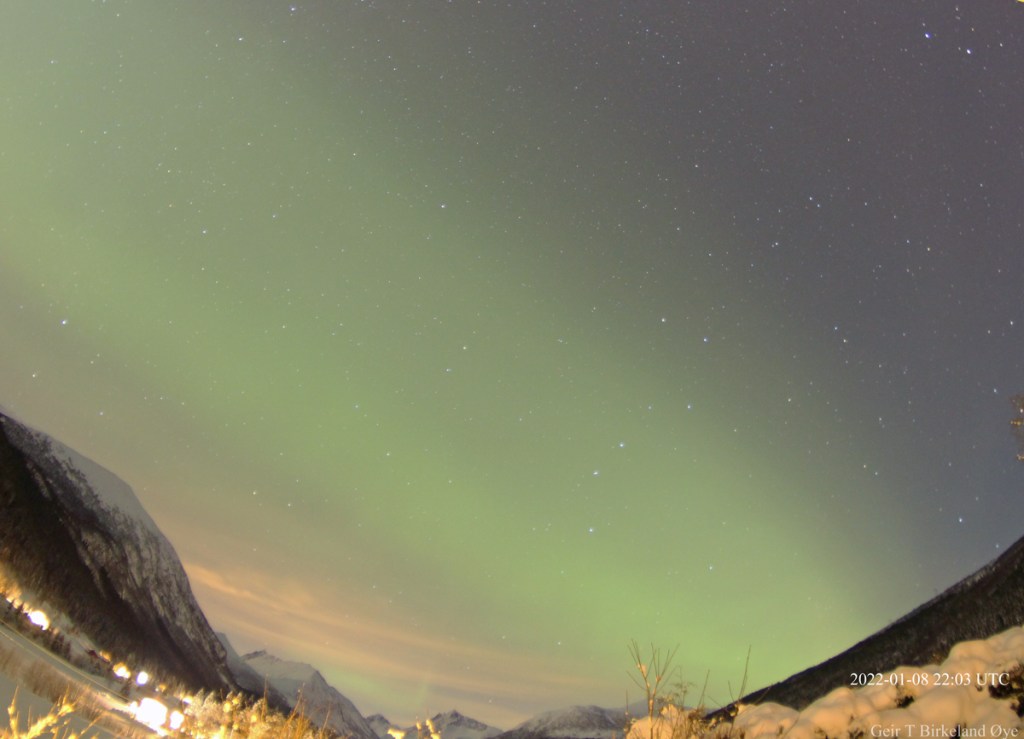
Local time: 23:03 – first thin parallel stripes
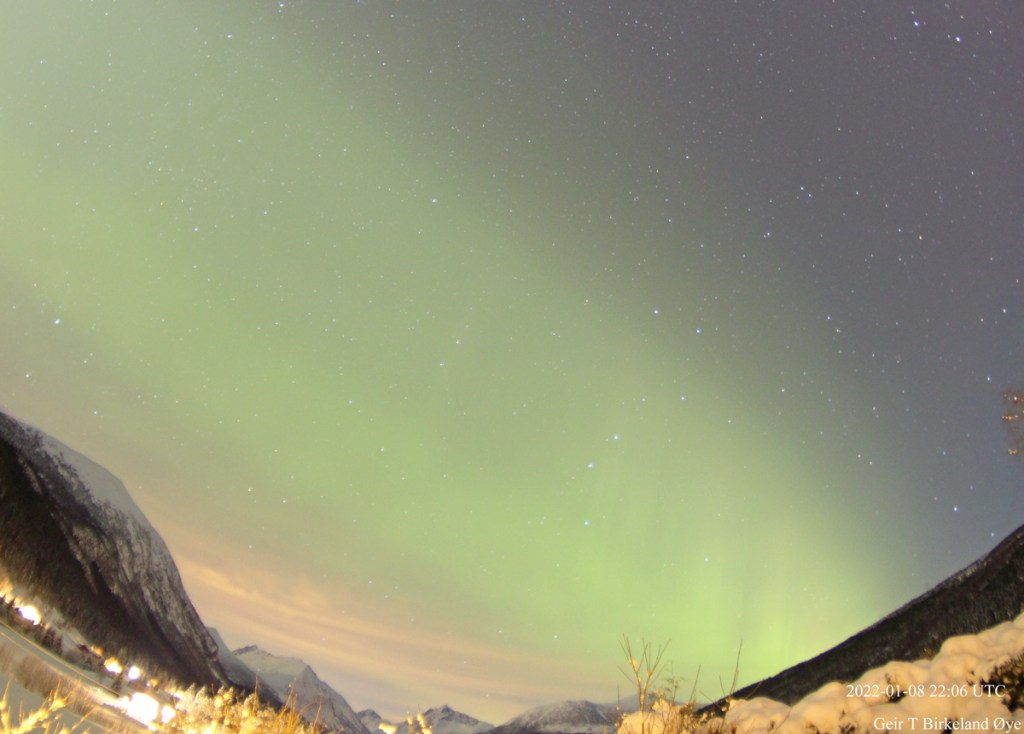
Local time: 23:06 – clearer stripes; brighter aurora above
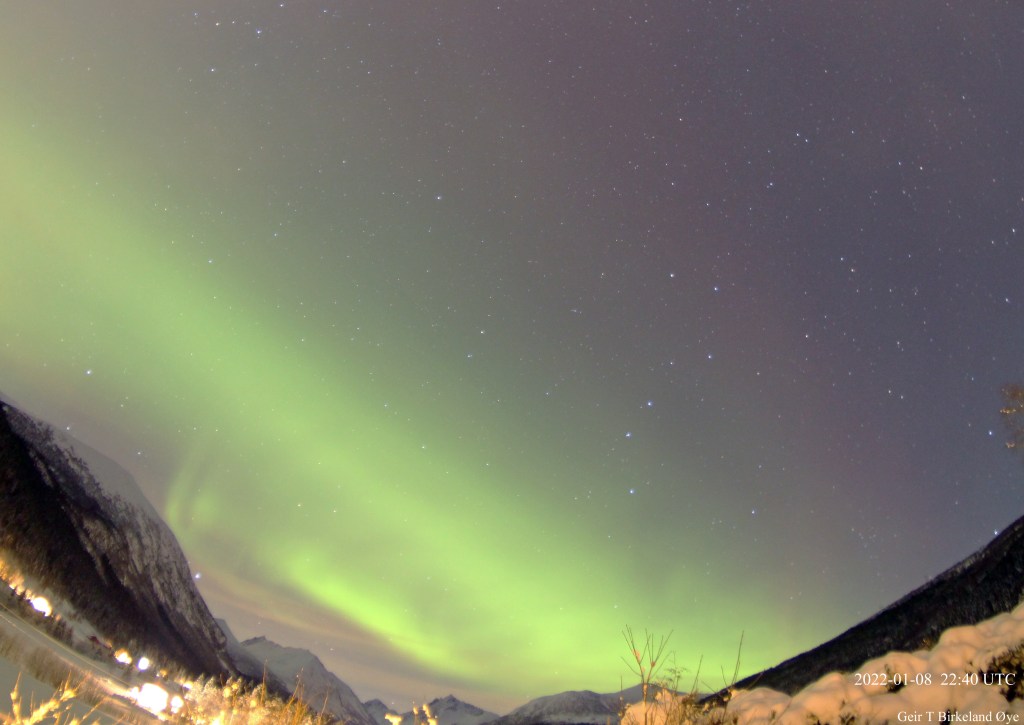
Local time: 23:40 – distinct banded pattern
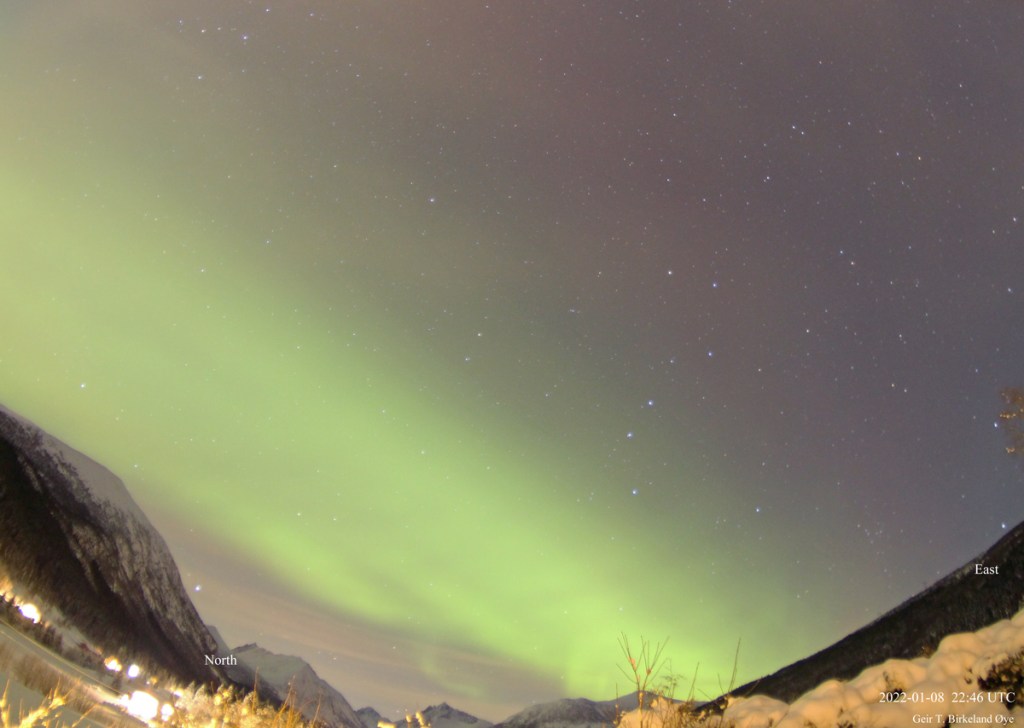
Local time: 23:46 – weaker but still visible banded structure
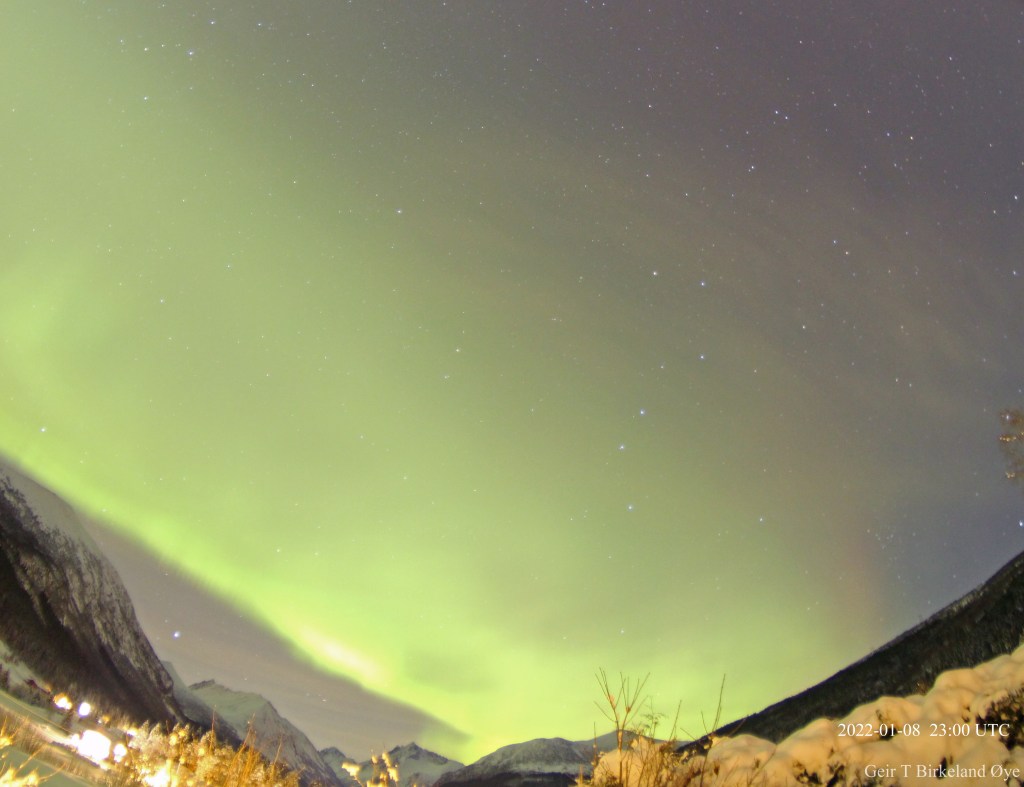
Local time: 00:00 – final faint stripes before fading
Summary
This sequence documents the transition from a faint southern structure into clearly defined parallel bands and later auroral dunes. The images are numbered in chronological order to show the development step by step.
This observation was recently recovered from a broken cameras’ memory card, and now presented.
RAGDA → Auroral Dunes
A rare light transformation in Earth’s upper atmosphere
– RAGDA – a quiet glow high in the ionosphere
RAGDA is a faint, wide glow that appears south of the normal auroral zone.
It forms in the F‑region, about 200–300 km up, where electric fields push ions sideways and heat oxygen.
The light is calm and diffuse – often a sign that the upper atmosphere is changing.
– Auroral Dunes – wave patterns in the green aurora
Auroral Dunes are a rare auroral pattern that looks like parallel waves or sand dunes.
They form much lower, around 100 km, where oxygen emits green light after being hit by energetic particles.
The wave pattern is shaped by atmospheric gravity waves imprinting structure into the aurora.
– The transition
Under certain conditions, a calm RAGDA band at 200–300 km can change shape, become more wavelike, and drift into the auroral zone.
As energy increases and gravity waves take over, the emission shifts toward 100 km, forming Auroral Dunes.
This represents a smooth transition between two heights, two energy regimes, and two atmospheric layers – a phenomenon rarely documented.
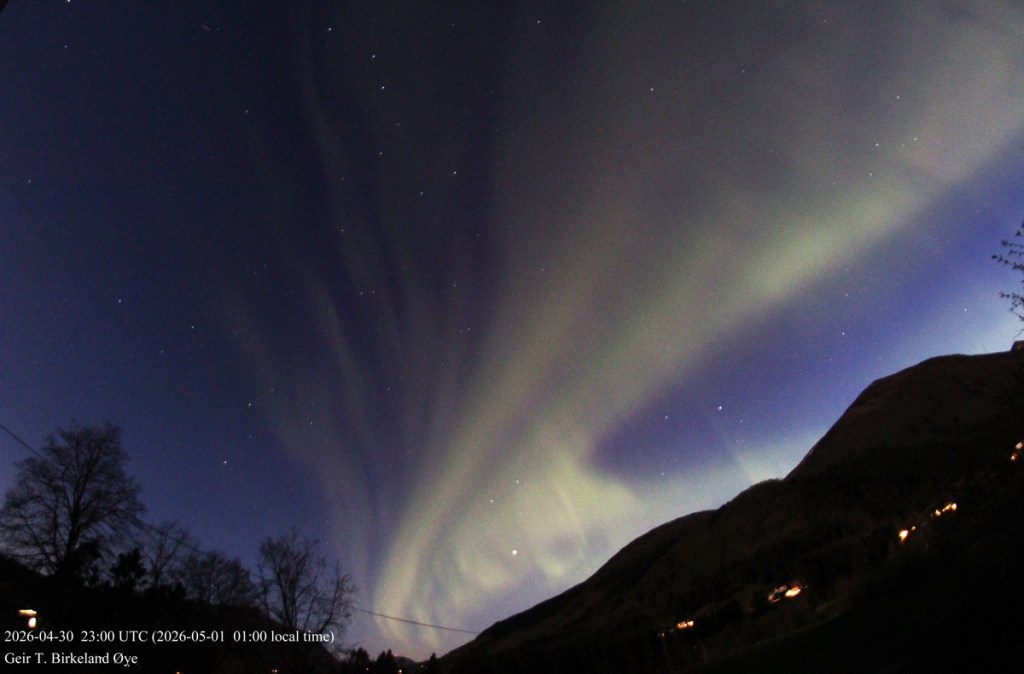
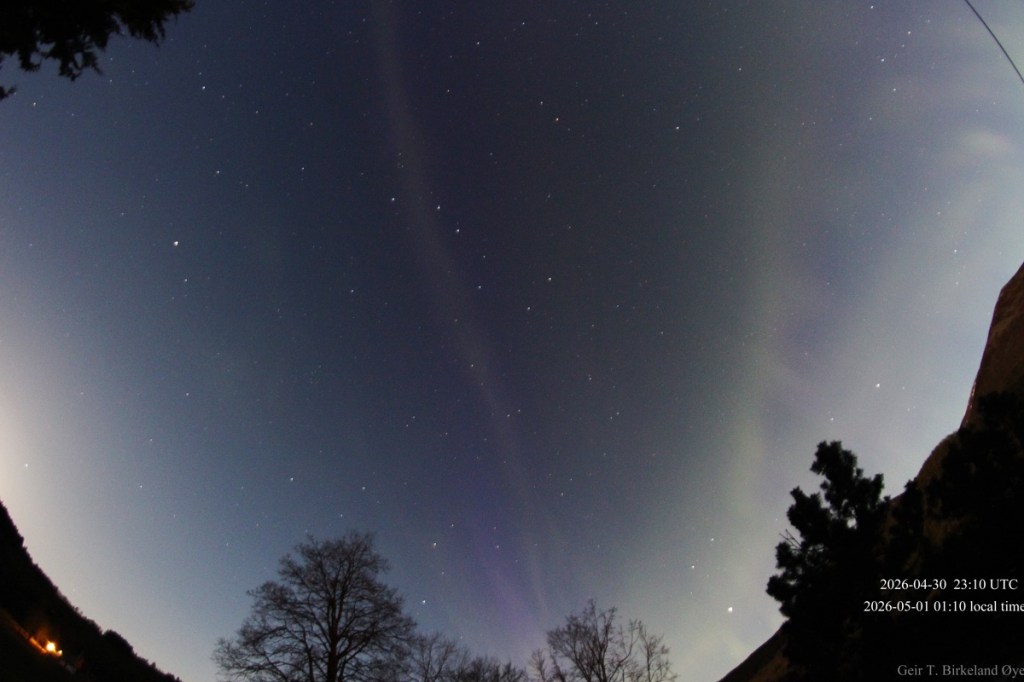
This STEVE event on May 1, 2026 consisted of two distinct phases: an earlier 23:10 UTC exposure showing faint picket fence low above the treeline, followed by a later 23:15–23:16 UTC phase where STEVE appeared alone. The images below document both phases.
Phase 1 — 23:10 UTC (STEVE with faint picket fence)
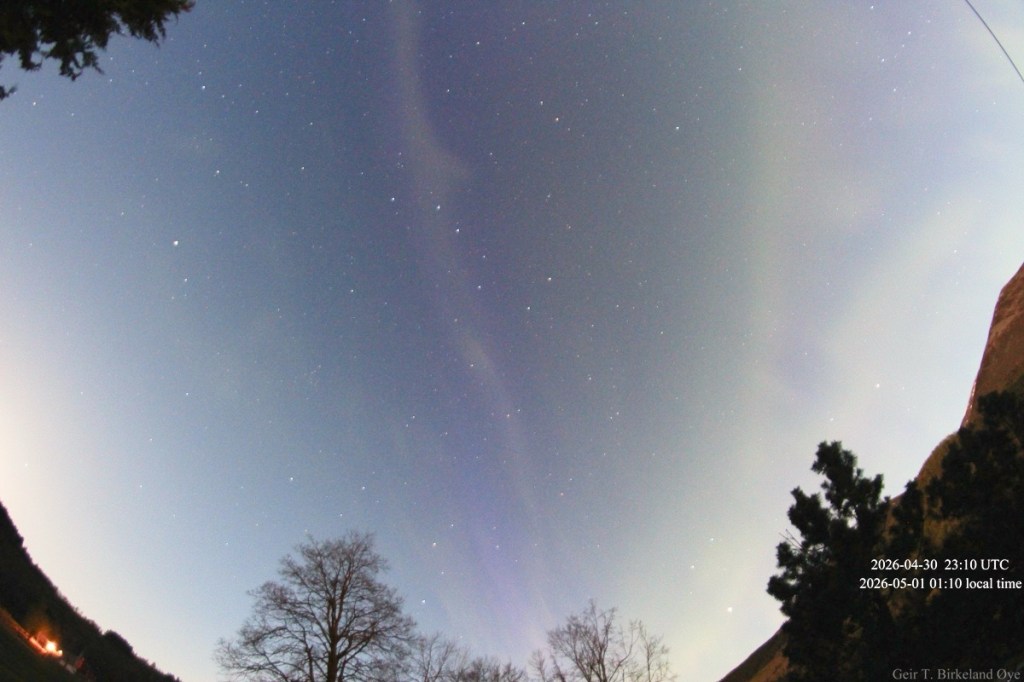
A narrow subauroral arc appeared over Follestaddalen around 23:10 UTC, following a clear separation from the auroral oval. The structure, timing, and behaviour were consistent with a STEVE‑like event. Although the characteristic mauve colour was difficult to see visually due to bright moonlight and a generally bright sky, the camera sequence revealed a narrow, uniform arc crossing directly through zenith.
The viewing geometry is important for interpreting the green structures beneath the arc. Because the STEVE arc passed overhead, the green, vertically structured band (“probable picket fence”) was seen directly from below. This foreshortens the vertical columns and causes them to appear broad, diffuse, and partially overlapping, rather than as the sharp, well‑separated spikes typically seen when picket fence is observed closer to the horizon. The sequence shows a faint but vertically modulated green band near the crossing point, consistent with a weak or developing picket‑fence structure.
This was a short‑lived late‑season event, lasting only a few minutes before fading into the brightening spring sky.
Summary of the May 1, 2026 STEVE Event
The event unfolded in two stages. At 23:10 UTC, a narrow SAID structure appeared above the treeline with faint picket‑fence elements. As the SAID band shifted slightly, the true STEVE arc — a thin mauve N₂⁺ line — became visible behind it, revealing the layered geometry of the system.
By 23:15–23:16 UTC, SAID had weakened into a diffuse green subauroral band, while STEVE remained as a narrow, isolated arc. No picket fence was present in this later phase.
A clean transition was observed:
23:10 — STEVE + faint PF + narrow SAID
23:15–23:16 — STEVE alone + diffuse green band
Please see the entire sequence below.
Image Sequence
Phase 2 — STEVE alone
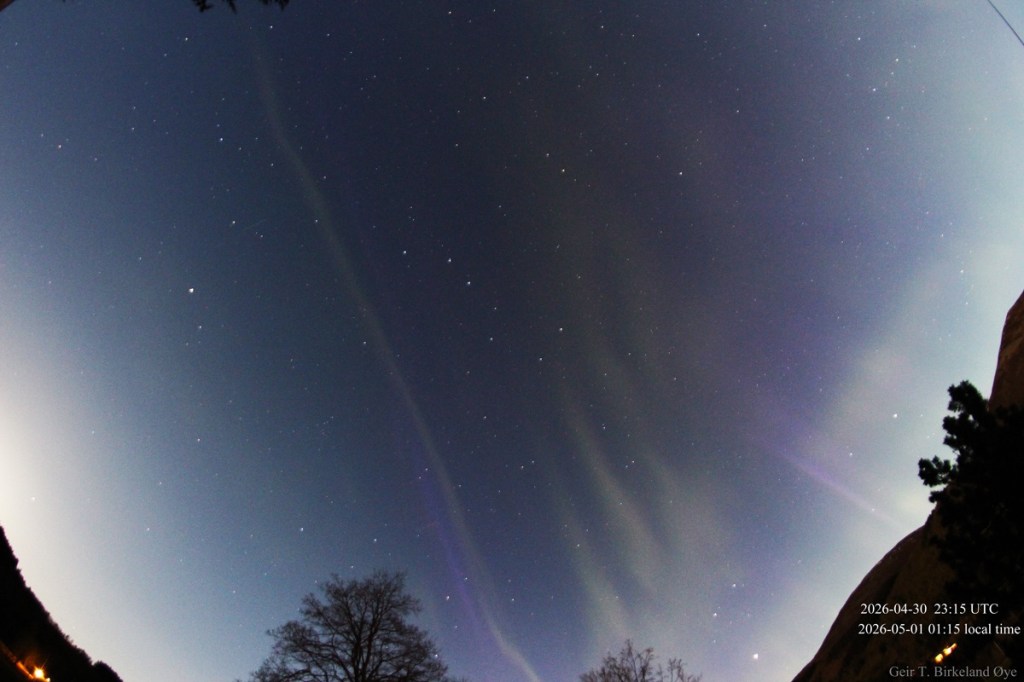
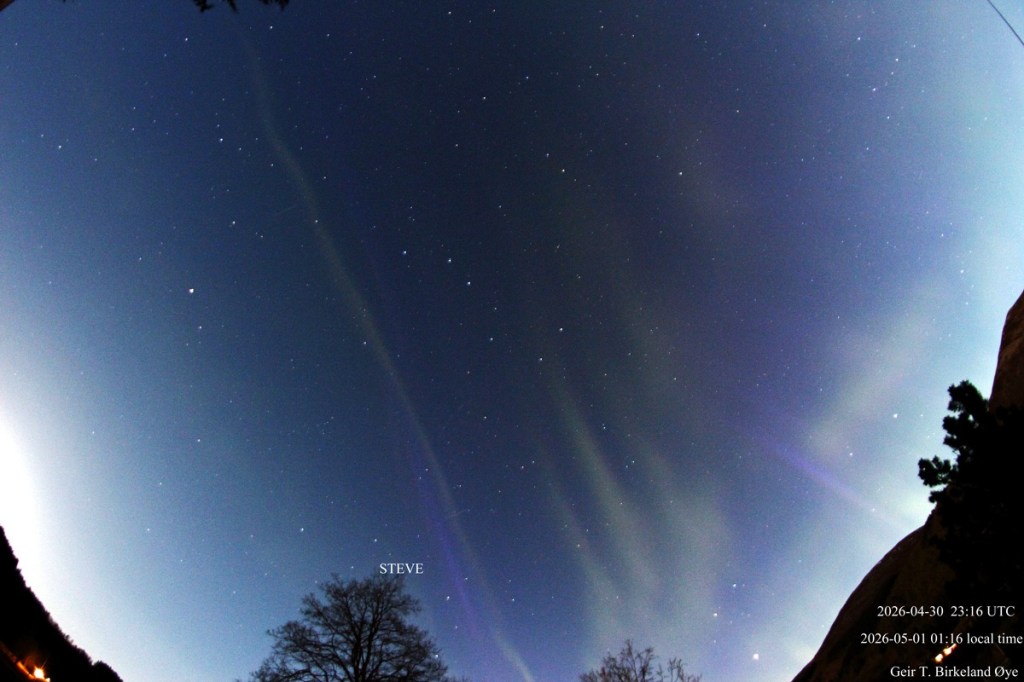
The green diffuse emission
The green diffuse emission below the STEVE band is not picket fence.
This is a weak subauroral green emission layer caused by low‑level particle precipitation north of the SAID/STEVE region.
It often appears together with STEVE in images, but it is physically separate from the STEVE mechanism and does not form vertical structures.
Phase summary
Phase 1 (23:10): Clear picket fence north of the STEVE region.
Phase 2 (23:15–23:16): STEVE without PF; weak green diffuse emission appears below the band at 23:16.
Color profile
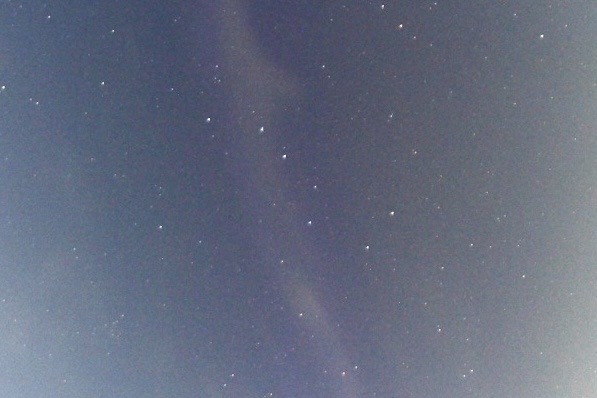
Scientific summary
Equipment: Canon EOS 650D with an 8 mm fisheye lens, ISO 1600, and varying exposure times depending on sky brightness.
______________________________________________
STEVE – eit smalt, lilla lysband i den øvre atmosfæren
STEVE (Strong Thermal Emission Velocity Enhancement) er eit sjeldent himmelfenomen som ser ut som eit smalt, lilla eller rosa lysband som ligg sør for den vanlege nordlyssona. Det er ikkje klassisk nordlys, men eit subauroralt fenomen som oppstår når ionar i den øvre atmosfæren blir skyvde ekstremt raskt sidelengs av sterke elektriske felt.
Kvar skjer STEVE?
STEVE oppstår i F‑regionen av ionosfæren, rundt 200–300 km over bakken – mykje høgare enn det grøne nordlyset.
Kva lagar lyset?
Lyset kjem frå oppvarma ionisert nitrogen (N₂⁺) som gløder i ein mauve/lilla farge.
Dette skjer når:
STEVE er altså eit varme‑ og hastighetsfenomen, ikkje eit partikkel‑bombardement som vanleg aurora.
Korleis ser STEVE ut?
Det ser ut som eit lysande, rett band som skjærer gjennom himmelen.
STEVE – a narrow, purple light band in the upper atmosphere
STEVE (Strong Thermal Emission Velocity Enhancement) is a rare sky phenomenon that appears as a narrow purple or pink arc south of the normal auroral zone. It is not traditional aurora, but a subauroral glow created when ions in the upper atmosphere are pushed sideways at extreme speeds by strong electric fields.
Where does STEVE occur?
STEVE forms in the F‑region of the ionosphere, around 200–300 km altitude — much higher than the green aurora.
What produces the light?
The glow comes from heated ionized nitrogen (N₂⁺) emitting mauve/purple light.
It appears when:
STEVE is therefore a heat‑and‑velocity phenomenon, not particle precipitation like normal aurora.
How does STEVE look?
It looks like a straight, glowing ribbon across the sky.
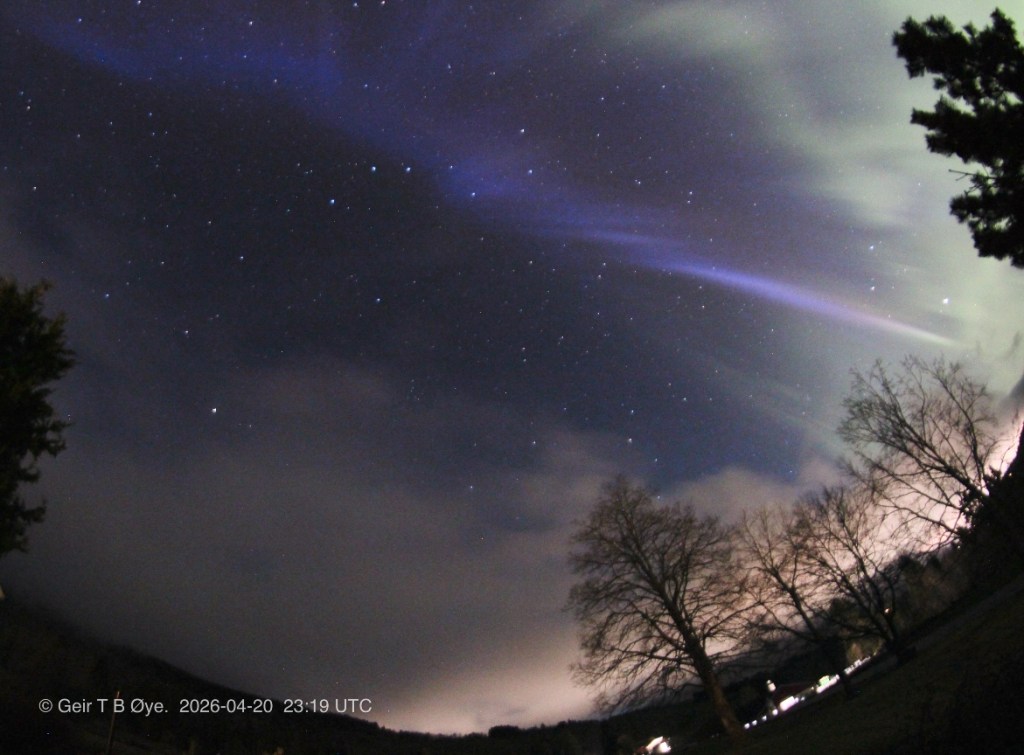
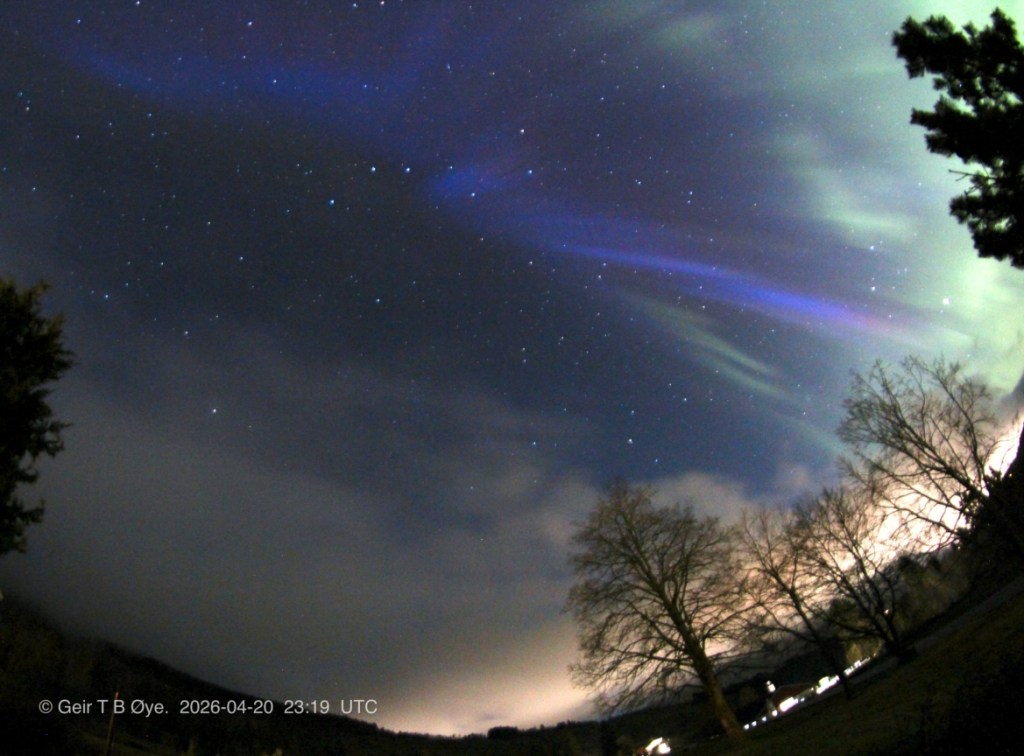
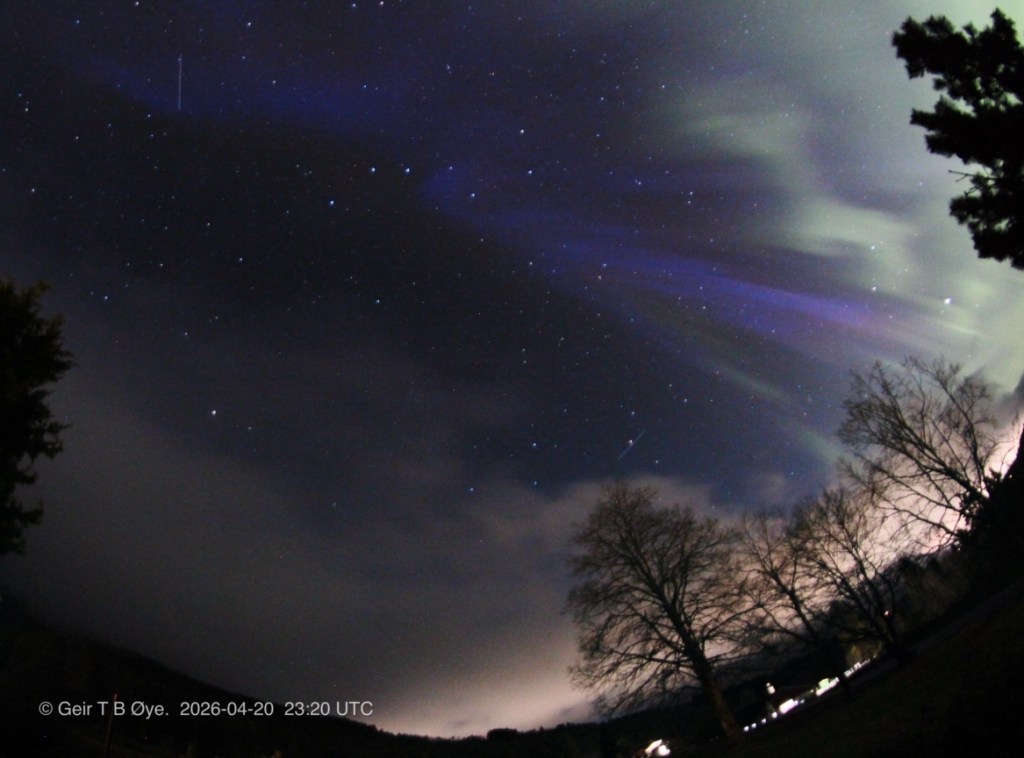
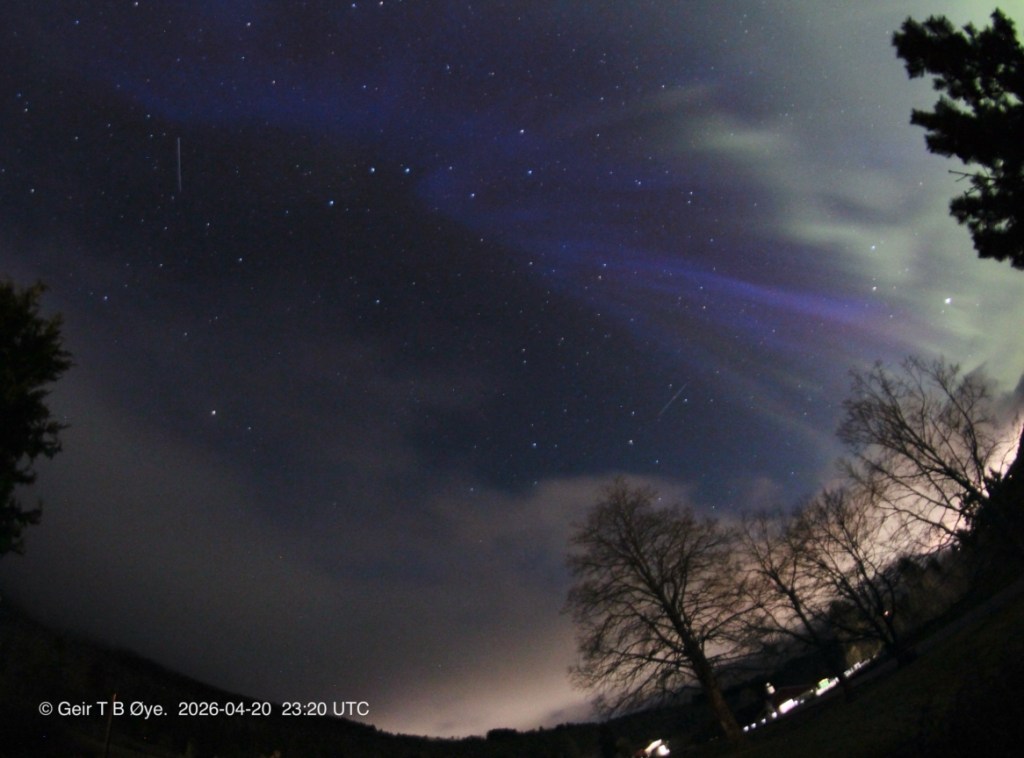
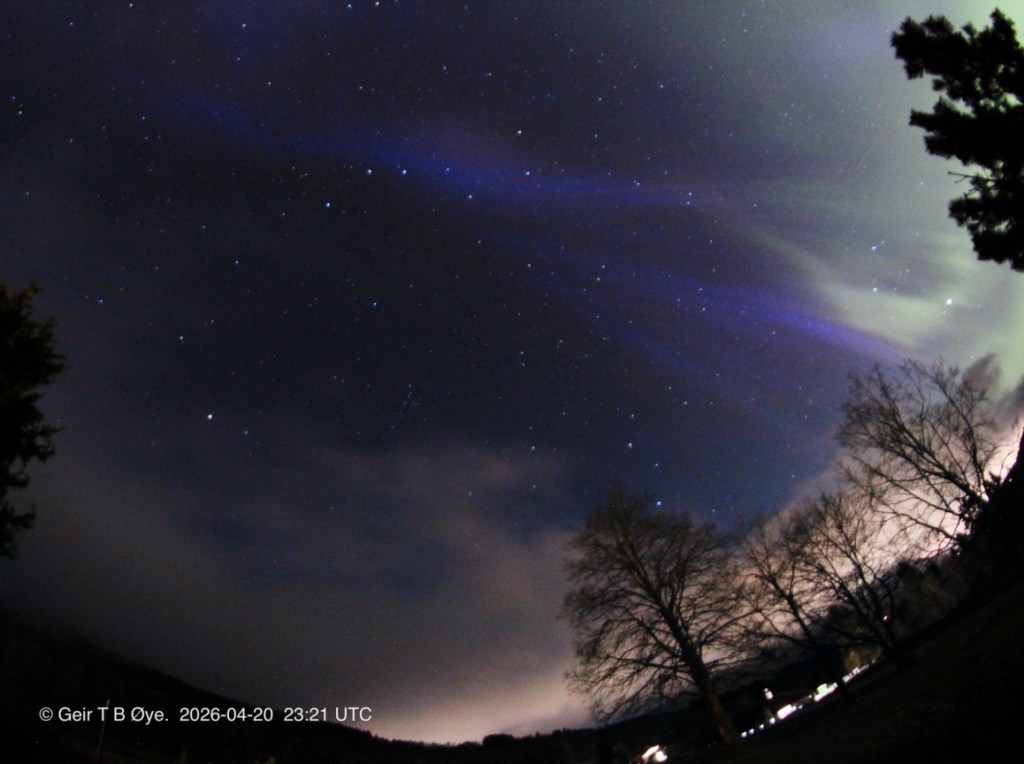
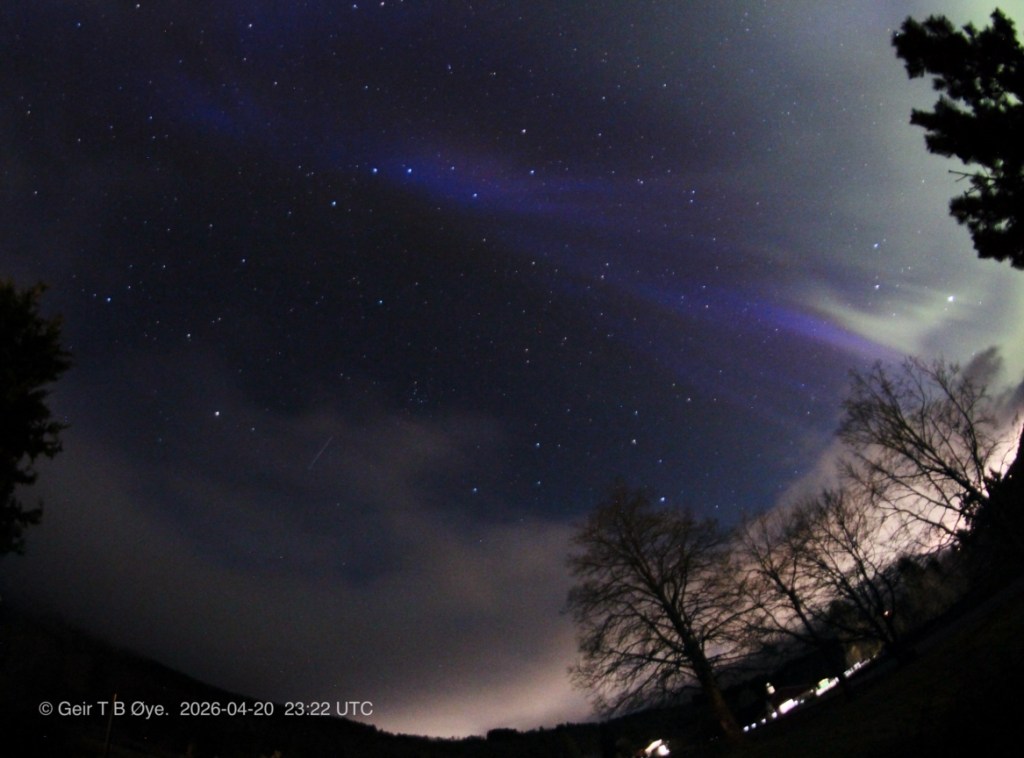
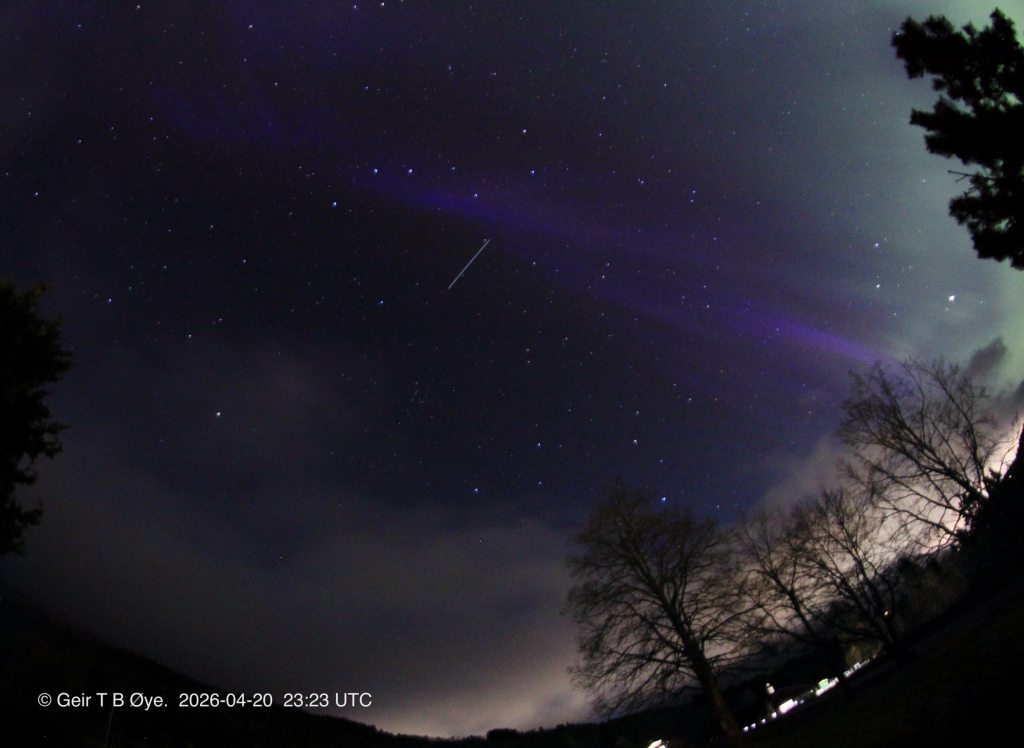
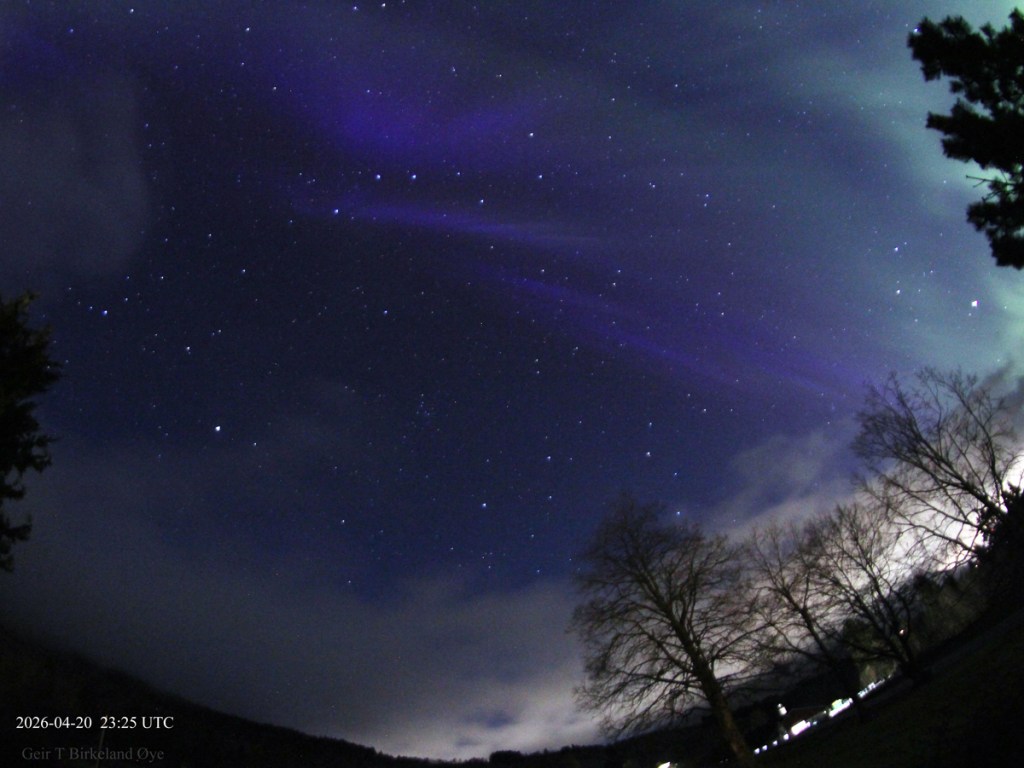
Blue‑tinged auroral corona observation
20 April 2026 — Ørsta, Norway
Time: 23:15–23:30 UTC (initial structured onset ~23:18 UTC)
Observation type: DSLR documentation of a partial auroral corona with blue‑violet lower emission.
Observer: Geir T. Birkeland Øye
Location: Ørsta, Norway
Instrument: Canon 650D, 8 mm fisheye, ISO 1600, short‑exposure sequence
Summary
A short‑exposure DSLR sequence recorded the development of a partial auroral corona directly overhead. The first structured rays appeared around 23:18 UTC, marking a brief local intensification during otherwise quiet geomagnetic conditions.
The lower part of the structure showed a blue‑violet tint, transitioning into green emission at higher altitudes. This colour impression is consistent with mixed auroral emissions and may include contributions from molecular nitrogen processes (N₂ / N₂⁺), although no spectroscopic data are available to confirm line dominance.
Auroral structure
The event formed a corona‑like pattern, with rays converging toward the zenith.
The geometry was not fully symmetric, and the corona did not develop into a stable, mature form.
Such partial or transient corona formations are well‑known during short‑lived intensifications.
Geomagnetic context
Global geomagnetic activity on 20 April 2026 was quiet to moderate (Kp 1–3).
However, regional Scandinavian magnetometer data show small, coincident disturbances during the observation window, consistent with a brief localised enhancement.
Short‑duration variations of this type are not always visible in 3‑hour Kp indices but can still produce brief auroral brightenings.
Geomagnetic data (TRO2A, local time)
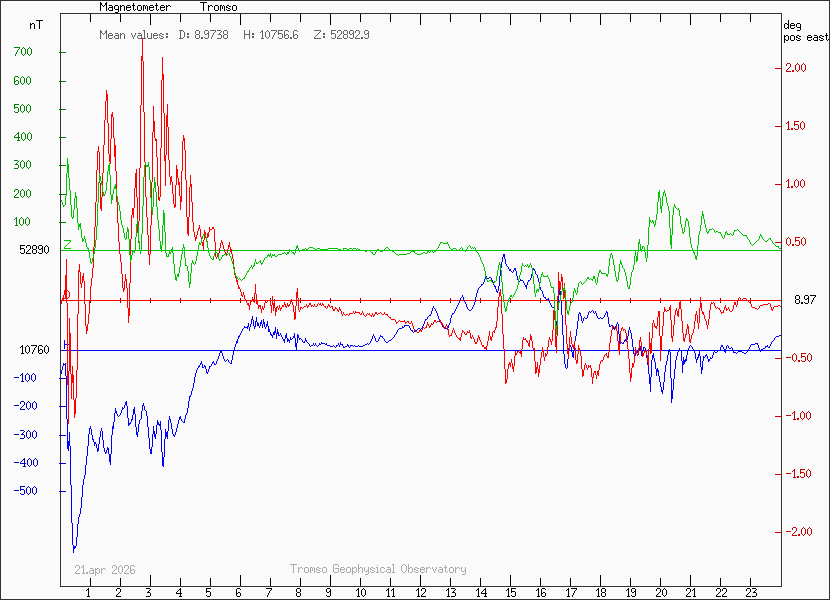
Geomagnetic signature (TRO2A magnetometer)
The small disturbance visible around 01:20 local time corresponds to 23:20 UTC on 20 April, matching the timing of the observed auroral intensification.
The H‑component shows a weak but clearly defined negative dip lasting a few minutes, while the D and Z components display synchronous minor variations. Such brief, low‑amplitude deviations are typical of localized auroral onset‑type intensifications and do not necessarily appear in the 3‑hour Kp index.
This signature supports the interpretation of a short‑lived auroral intensification with partial corona formation.
Source: Tromsø Geophysical Observatory (TRO2A)
The Solund (SOL1A) magnetometer shows weak but coincident variations around 23:20 UTC that correlate with the TRO2A negative dip. Although the SOL1A signal is smaller, the synchronous behaviour supports that the brief intensification observed in Ørsta was a real regional (localized) auroral enhancement rather than an instrumental anomaly.
Seasonal light conditions
At this time of year, the Sun remains only a few degrees below the horizon.
This twilight regime in the upper atmosphere can:
It does not increase auroral emission strength itself.
Interpretation
The event is best described as a short‑lived auroral intensification with partial corona formation, displaying a visually enhanced blue‑violet lower region.
The colour impression likely reflects a combination of:
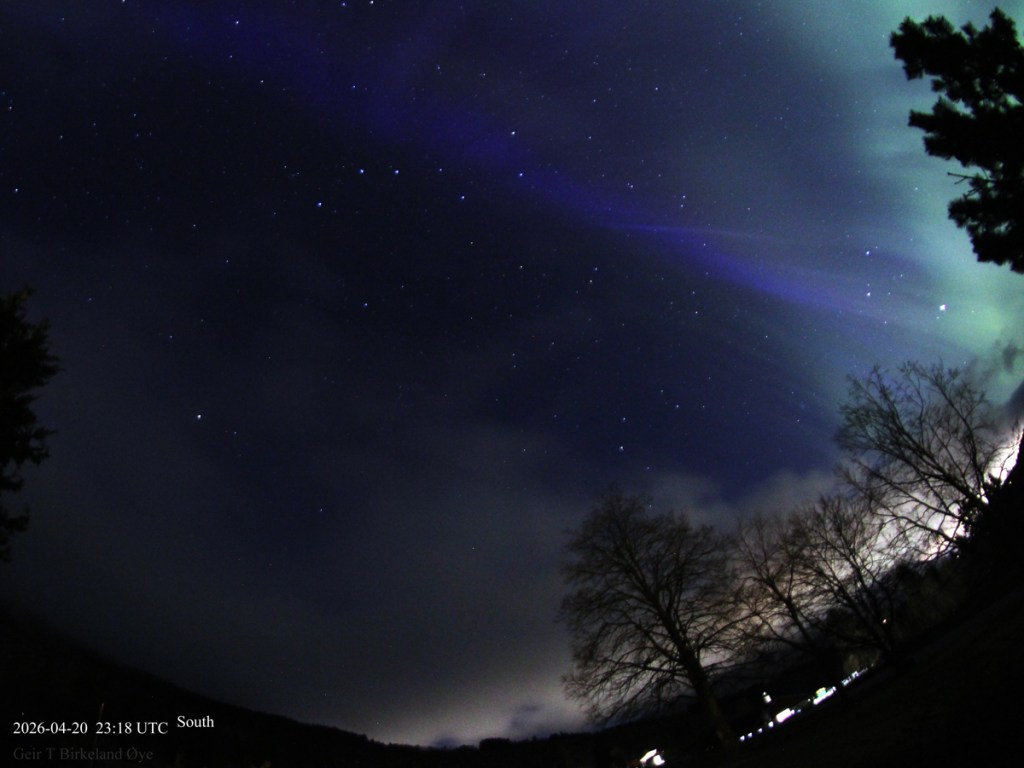
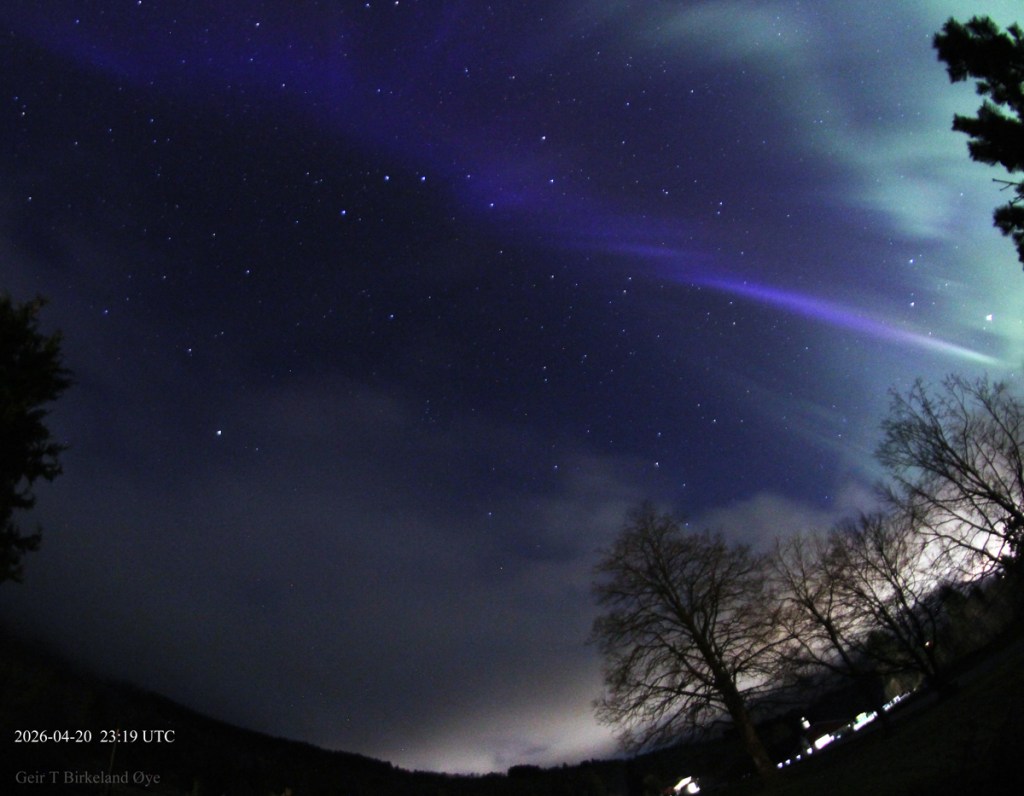
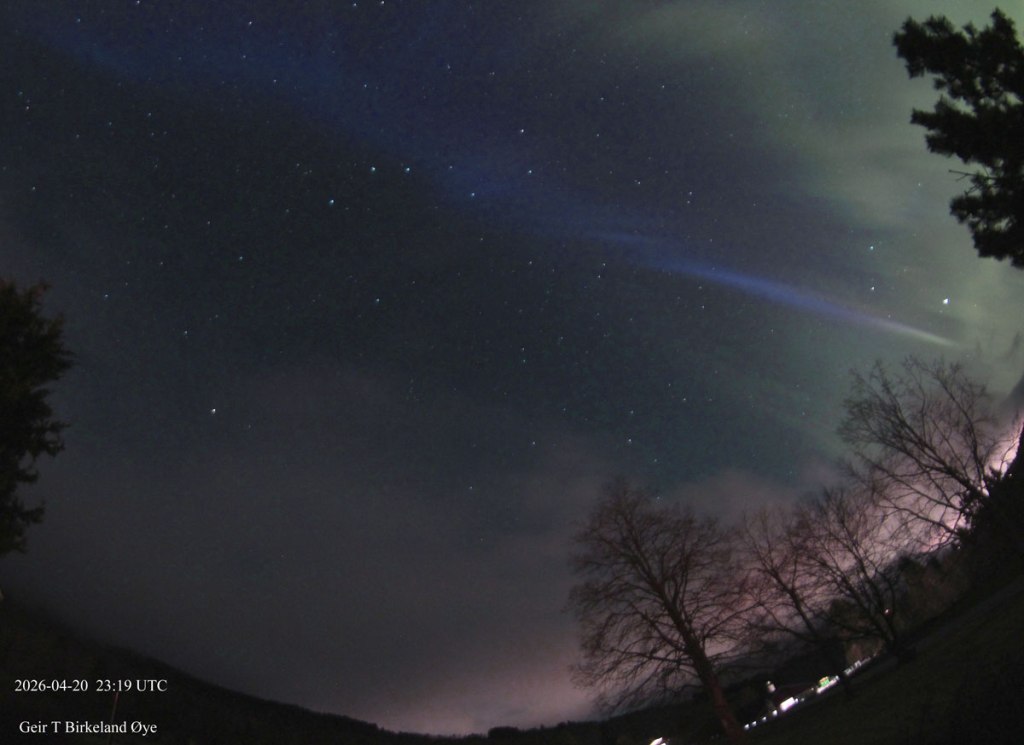
Corrected master version (cyan/blue reduction applied).
Additional reading
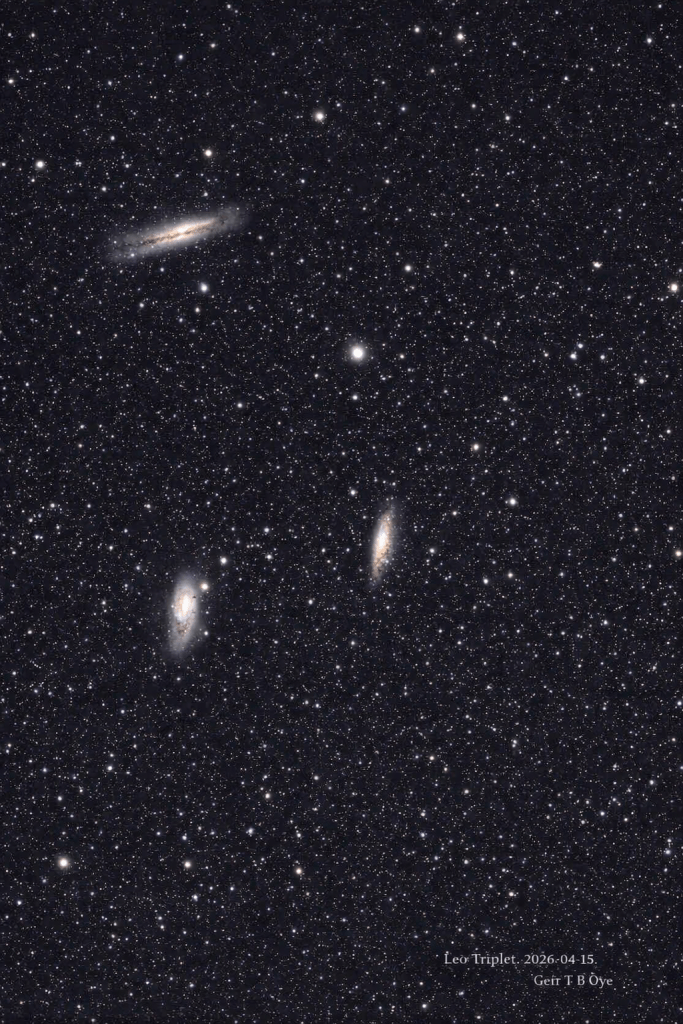
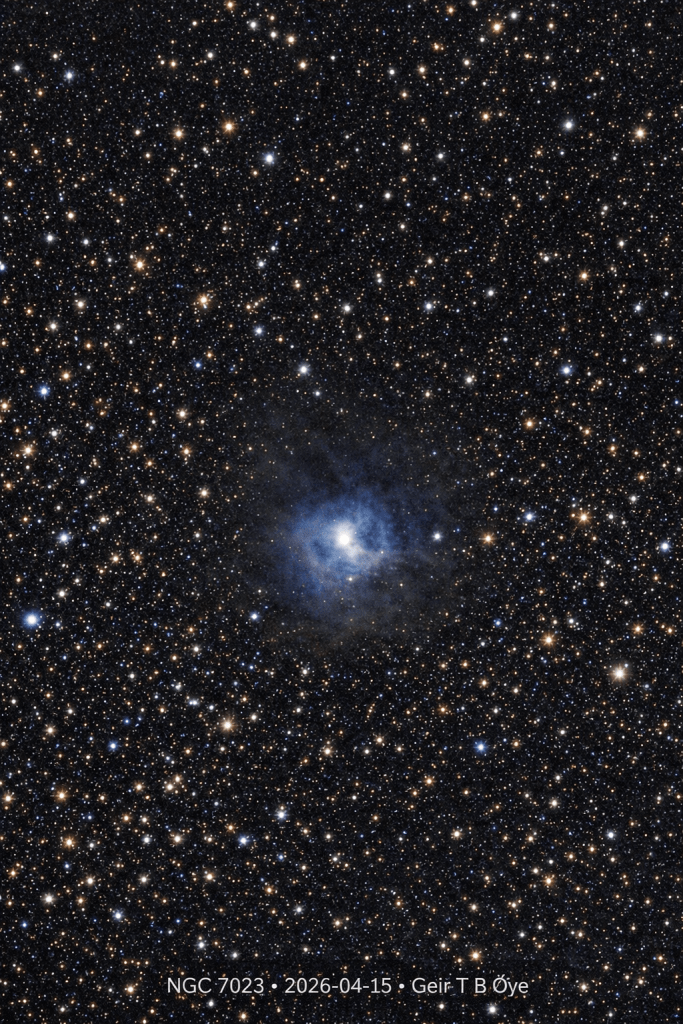
Three spiral galaxies — M65, M66, and NGC 3628 — captured in a single frame, revealing the graceful diversity of galactic forms across deep space.
Zwo Seestar S30.
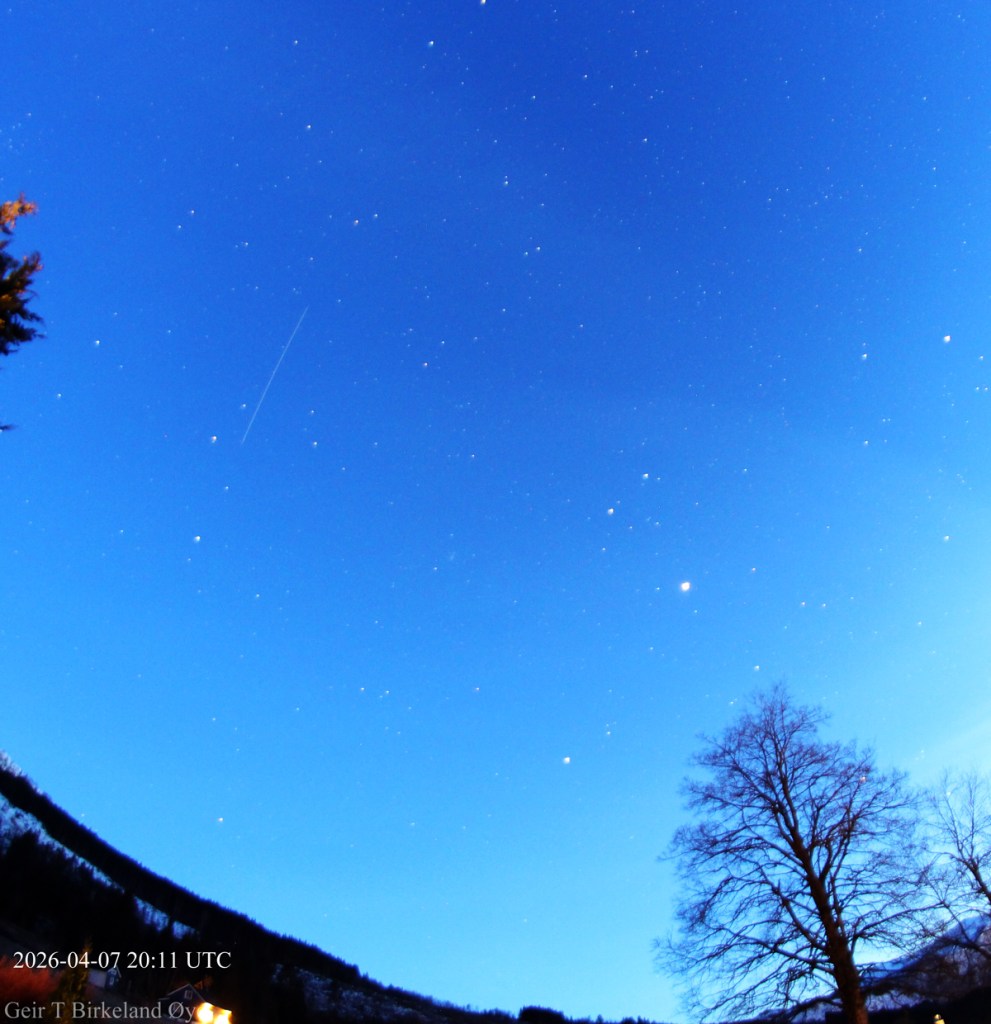
On Monday, April 6 at 7:50 p.m. PT, Falcon 9 launched 25 Starlink satellites to low-Earth orbit from Space Launch Complex 4 East (SLC-4E) at Vandenberg Space Force Base in California. This corresponds to 04:50 CEST on April 7 in Norway. The Starlink train passed over Norway later that evening at 22:11, and the image above shows the formation as seen from Ørsta.
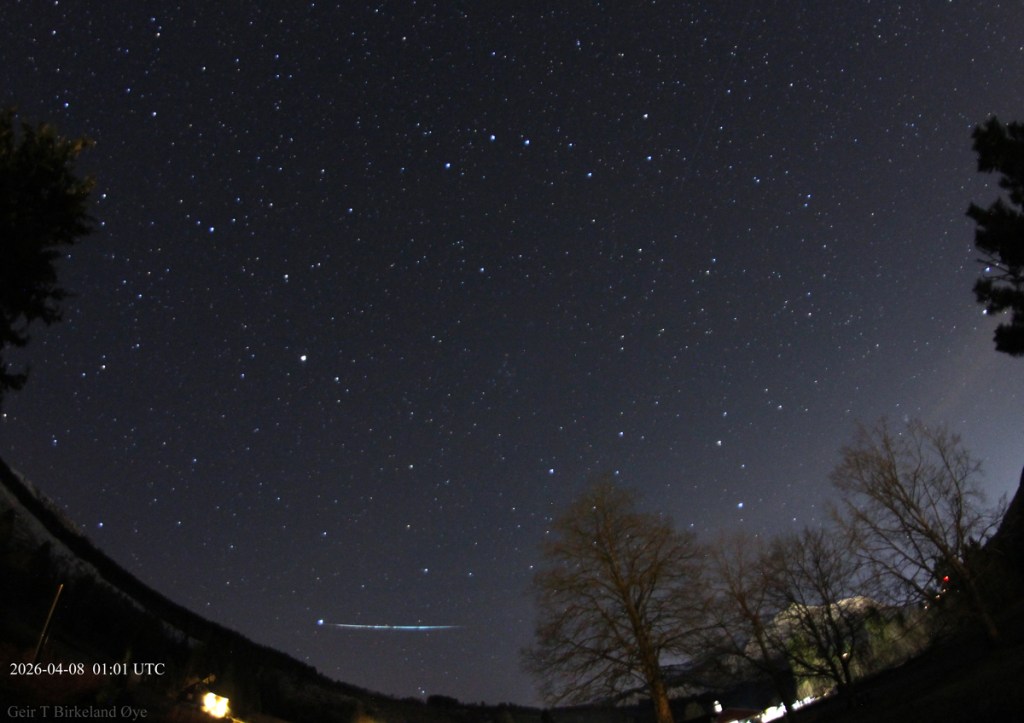
A colorful meteor streaking the sky in the morning hours of April 08, 2026.
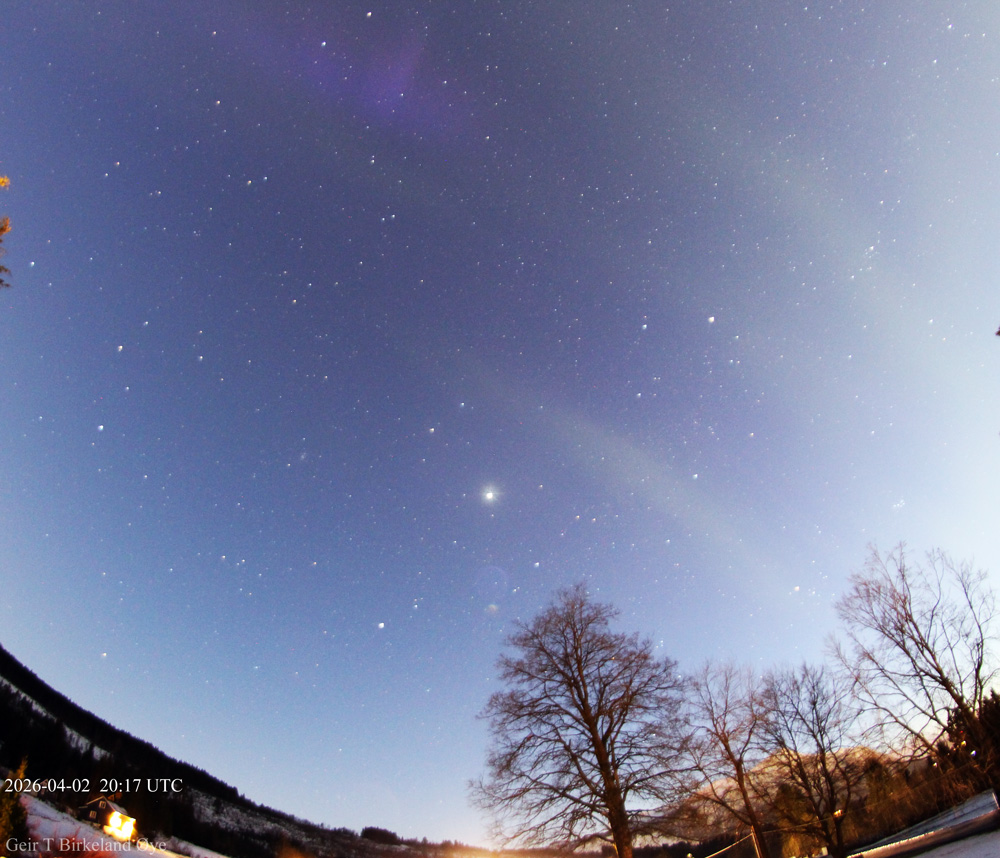
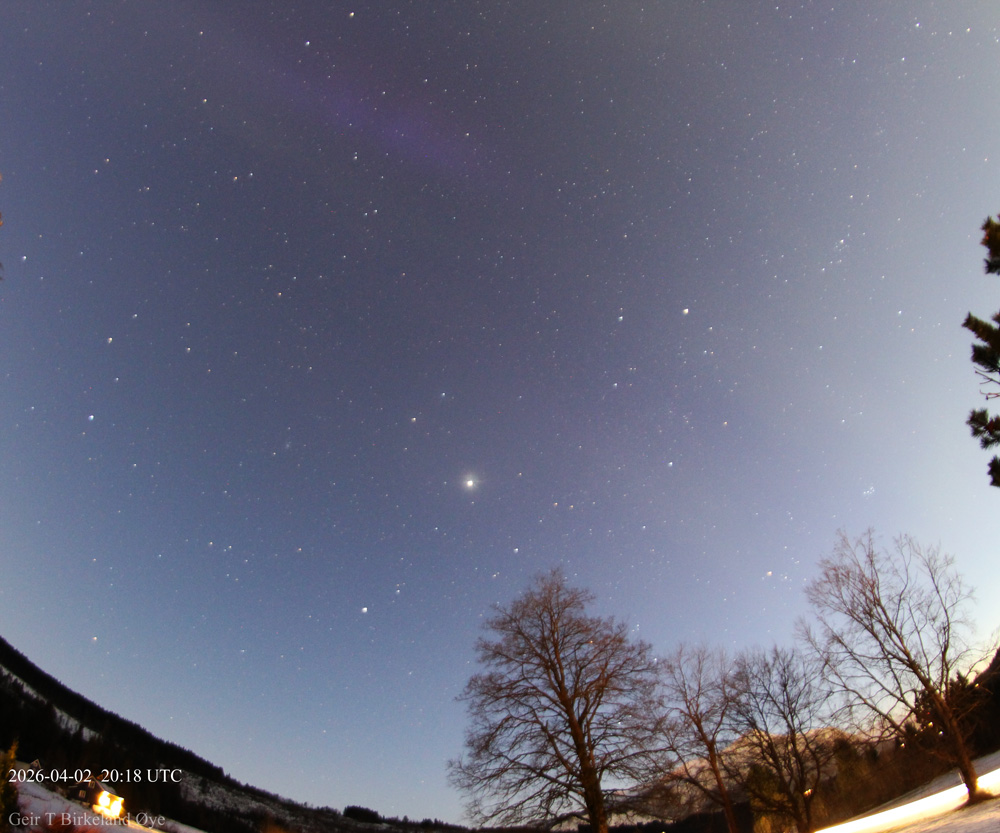
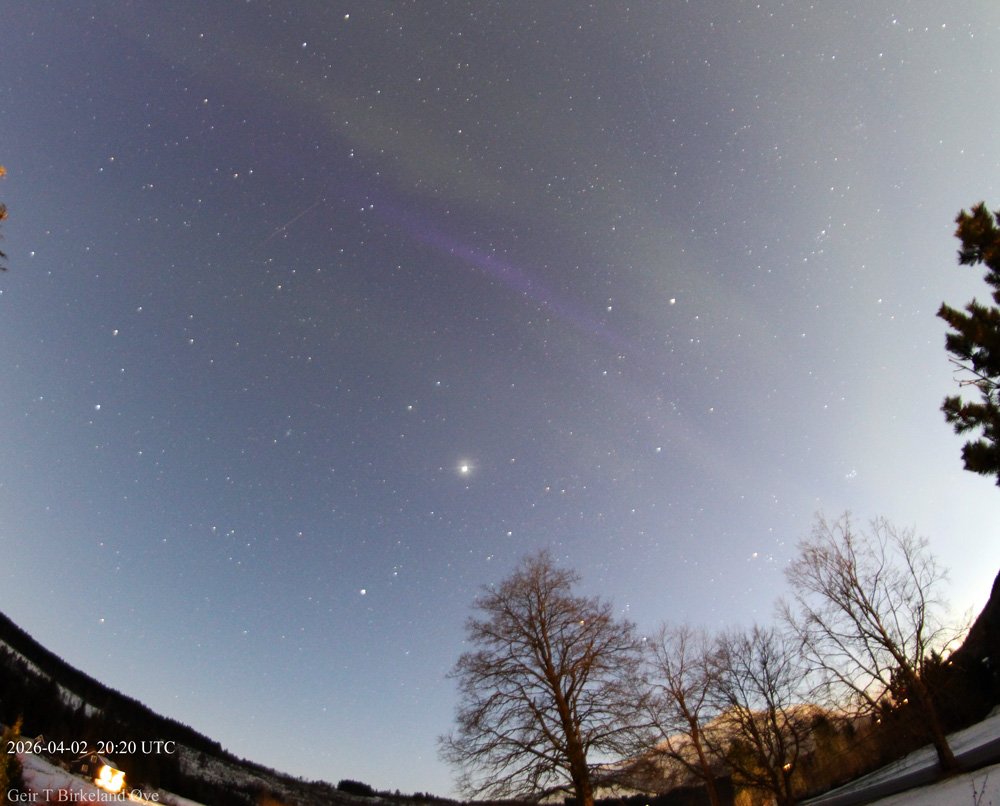
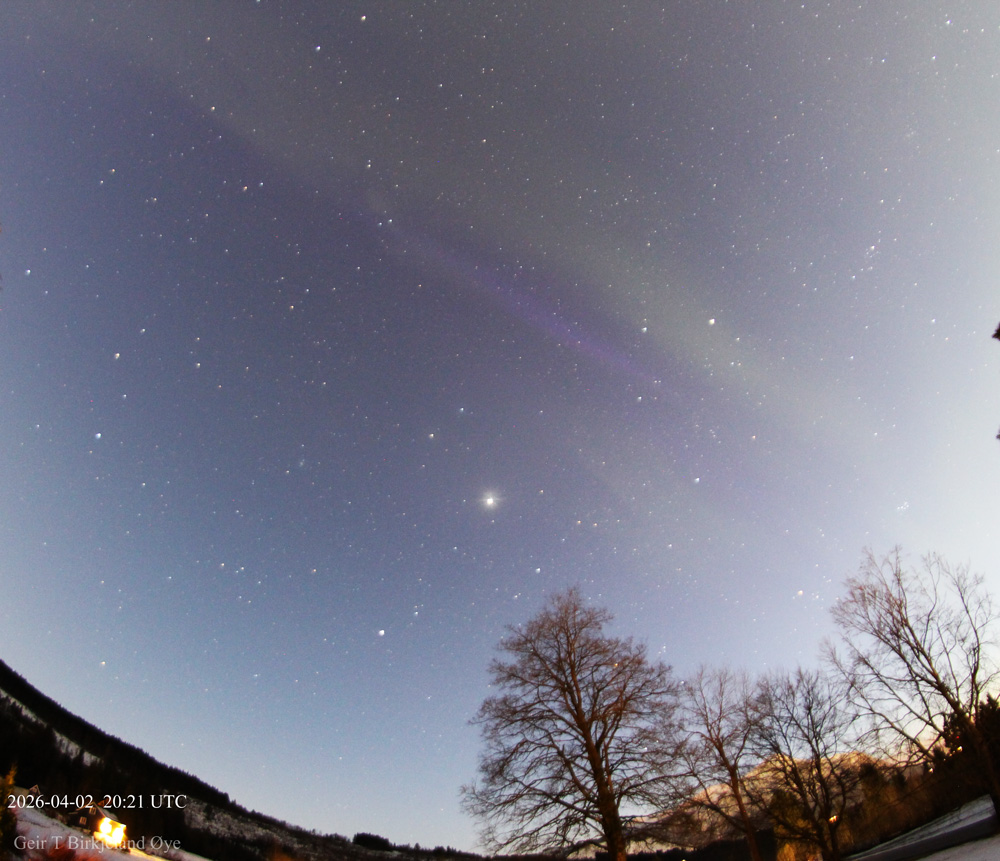
Transient STEVE‑like emission – 2 April 2026
STEVE‑type subauroral emission
2 April 2026 — Ørsta, Norway
Time: 20:16–20:22 UTC
Observation type: DSLR documentation of a transient subauroral STEVE‑like emission
Observer: Geir T. Birkeland Øye
Location: Ørsta, Norway
Instrument: Canon 650D, 8 mm fisheye lens, high‑resolution short‑exposure sequence
Summary
A transient subauroral optical emission consistent with the STEVE (Strong Thermal Emission Velocity Enhancement) phenomenon was observed south of the auroral oval on 2 April 2026. The event began as a compact purple/magenta subauroral blob around 20:16 UTC, which rapidly elongated into a narrow, well‑defined east–west arc. The emission persisted for approximately six minutes before dissipating.
Throughout the entire sequence, the structure displayed a stable purple–magenta continuum with no green (557.7 nm) or red (630.0 nm) oxygen‑line auroral features, and no curtain‑like or rayed morphology. This spectral appearance is characteristic of STEVE, which is known to produce broadband continuum emission rather than discrete auroral lines.
The full evolution—from initial blob to mature arc and final fading—was captured in a time‑stamped DSLR sequence.
Optical and morphological characteristics
This morphology aligns with documented STEVE events associated with SAID/SAPS channels.
Geomagnetic and solar‑wind context
Solar wind conditions on 2 April were already disturbed due to preceding coronal mass ejections (CMEs). Such conditions are favourable for the formation of subauroral ion drift channels, which can generate STEVE‑type emissions.
Key contextual points:
The brief duration (6 minutes) is fully consistent with known STEVE behaviour.
Interpretation
The event is best classified as a STEVE‑type subauroral emission, based on:
The high‑resolution, time‑stamped imagery provides a complete record of the event, including the rarely documented initial blob phase, making this a scientifically valuable observation.
Norsk
STEVE‑liknande subauroral emisjon – 2. april 2026
Ei kortvarig subauroral lysfenomen vart observert sør for nordlysovaen i Ørsta mellom 20:16 og 20:22 UTC. Hendinga starta som ein kompakt lilla/magenta “blob”, som raskt strekte seg ut til ein tydeleg aust–vest‑gåande STEVE‑struktur.
Emisjonen hadde gjennom heile forløpet ein jamn lilla/magenta kontinuerleg spektral karakter, utan grøne eller raude oksygenliner og utan gardin‑ eller strålestrukturar. Dette er typisk for STEVE, som ikkje er eit tradisjonelt nordlys, men eit optisk uttrykk for raske subaurorale ionedriftar (SAID/SAPS).
Solvindforholda var forstyrra av tidlegare CME‑ar, noko som gav gode vilkår for slike fenomen. Den korte varigheita er i tråd med kjende STEVE‑observasjonar.
Hendinga er klassifisert som ei STEVE‑type subauroral emisjon, og bileta dokumenterer heile utviklinga frå første blob til bortfall.
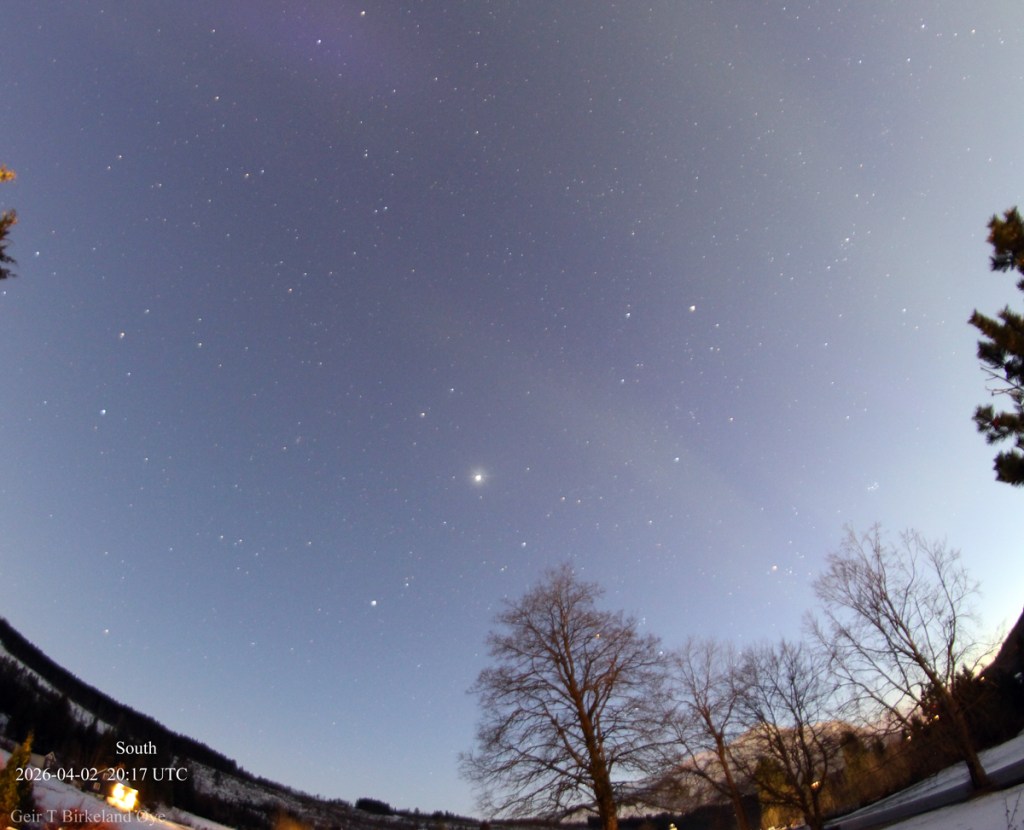
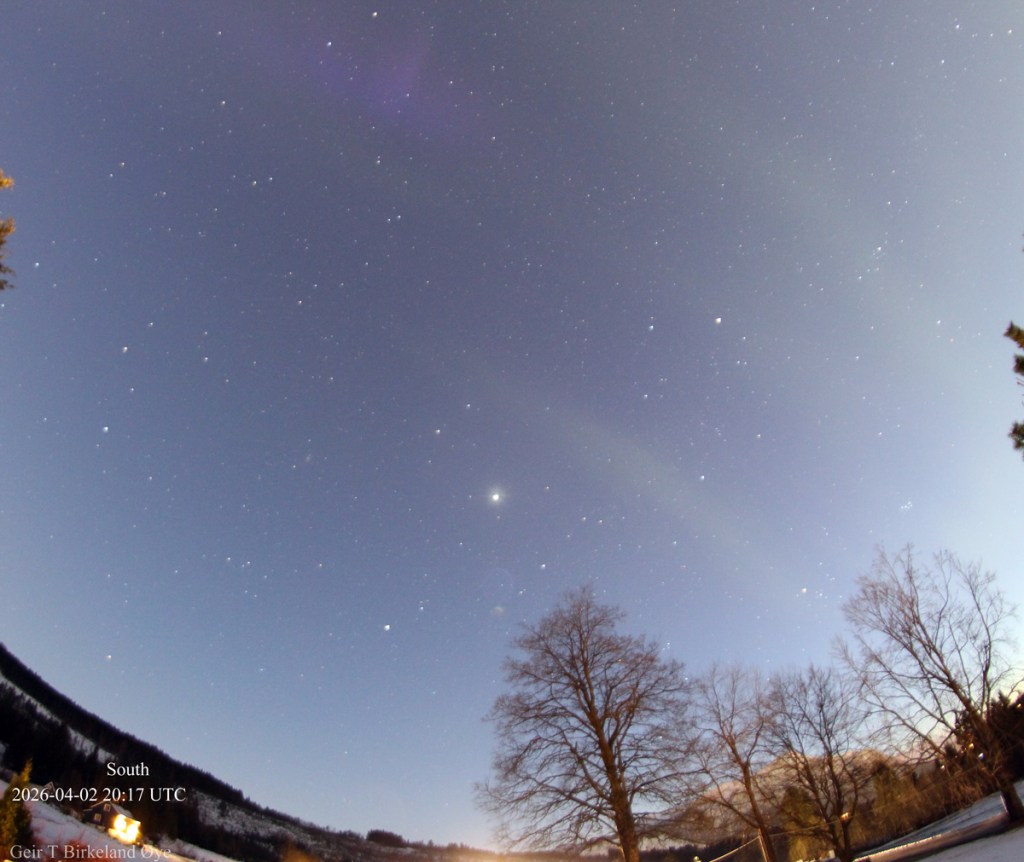
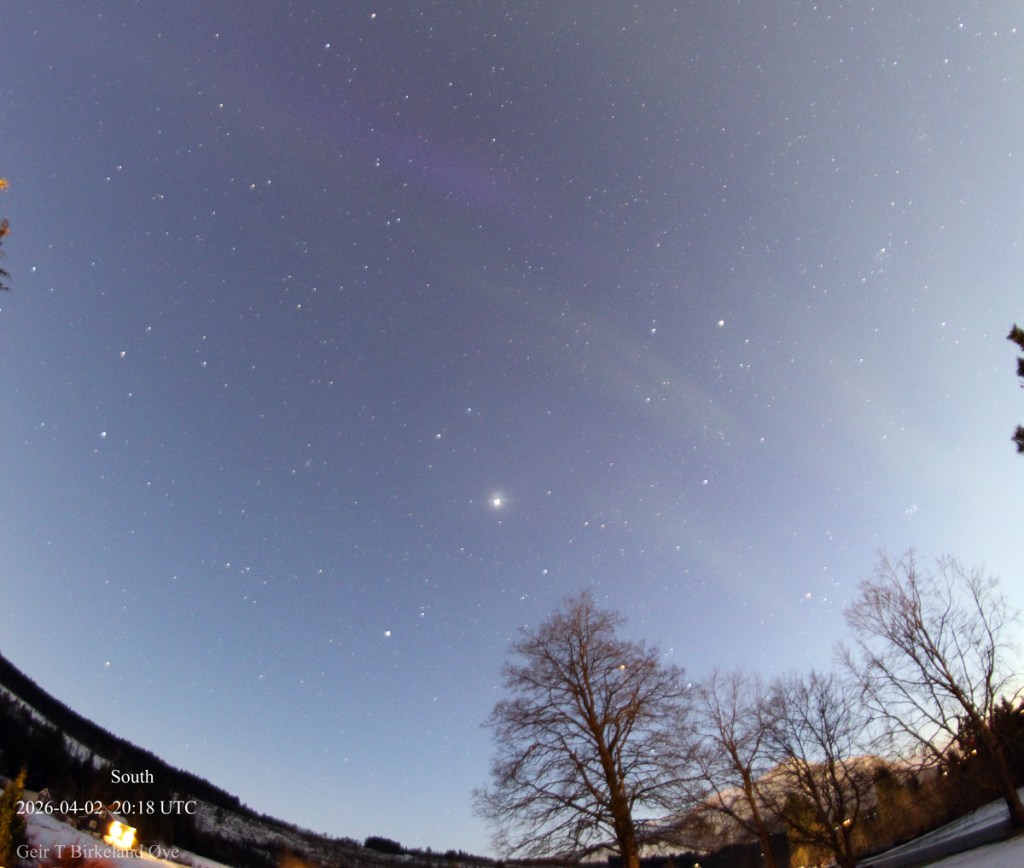
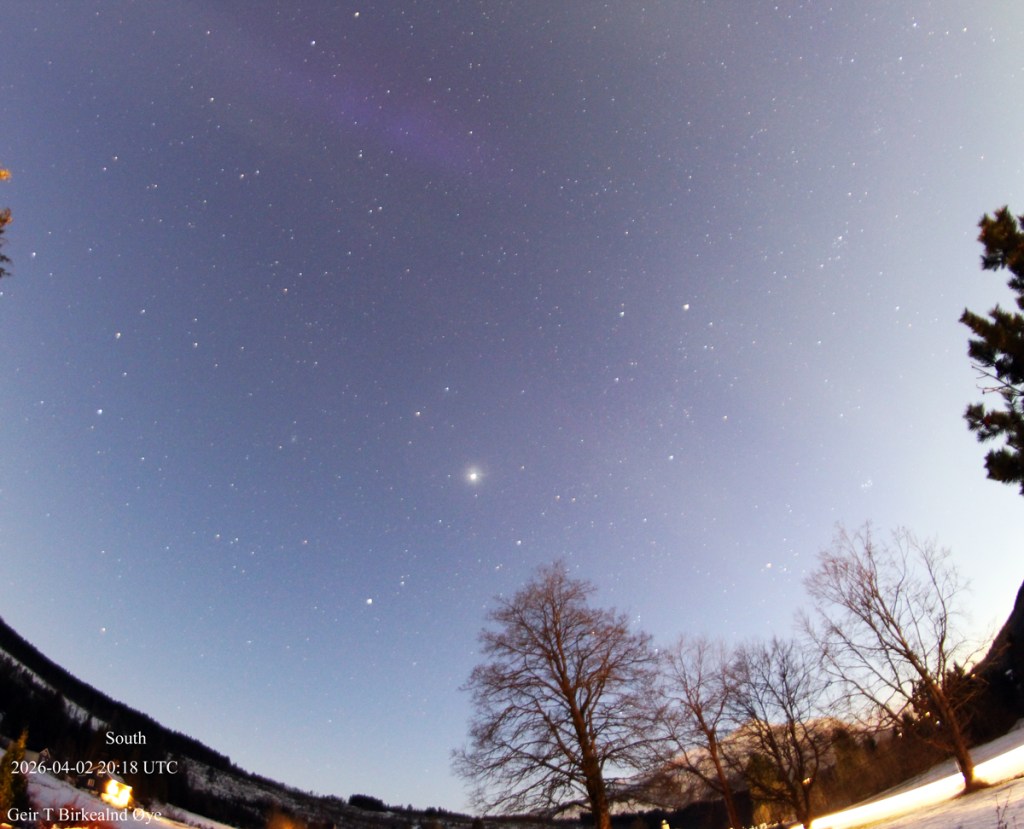
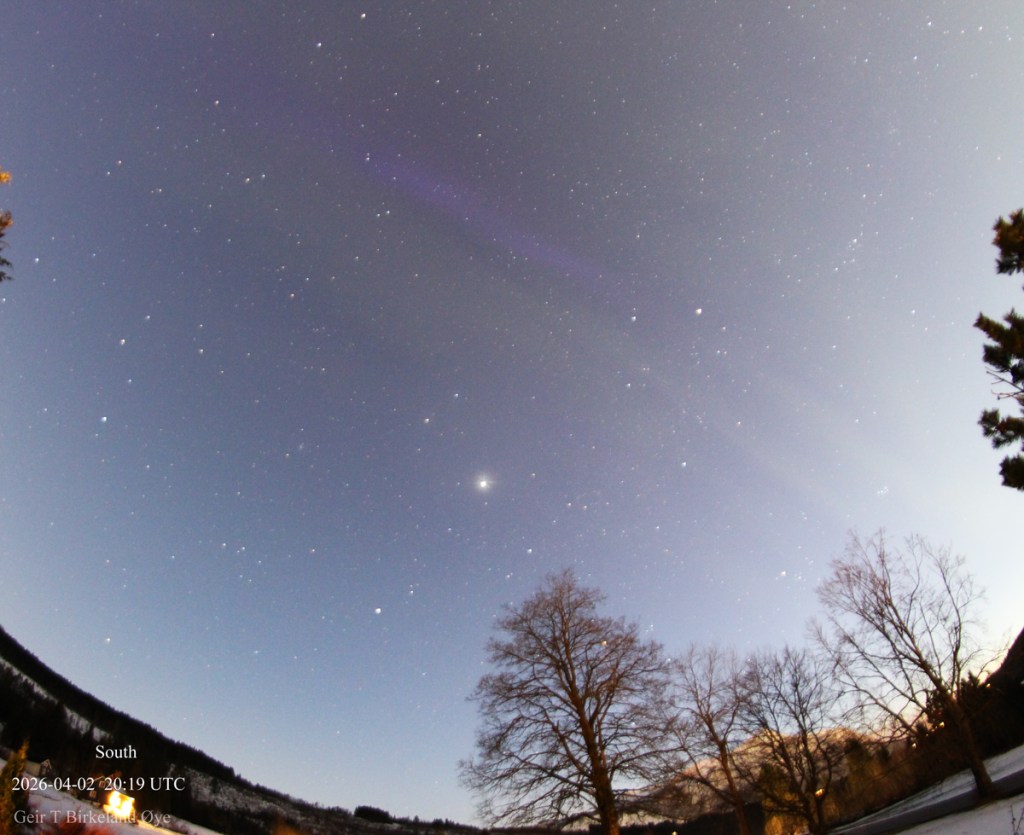
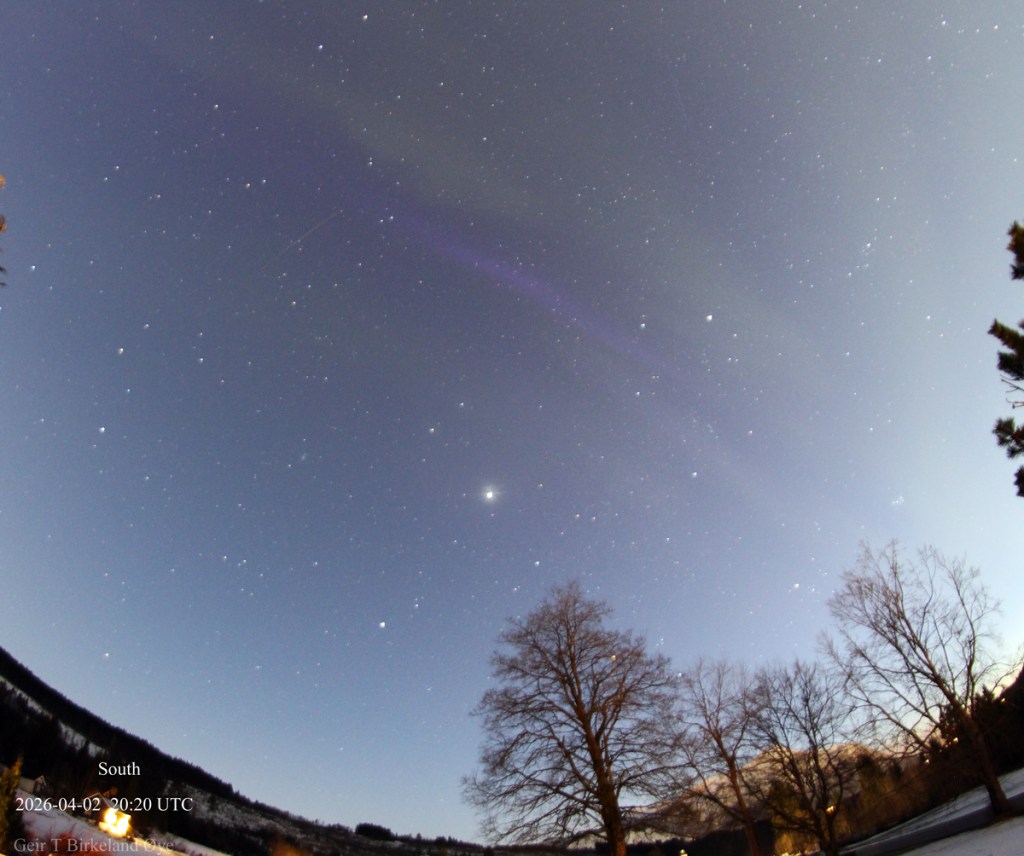
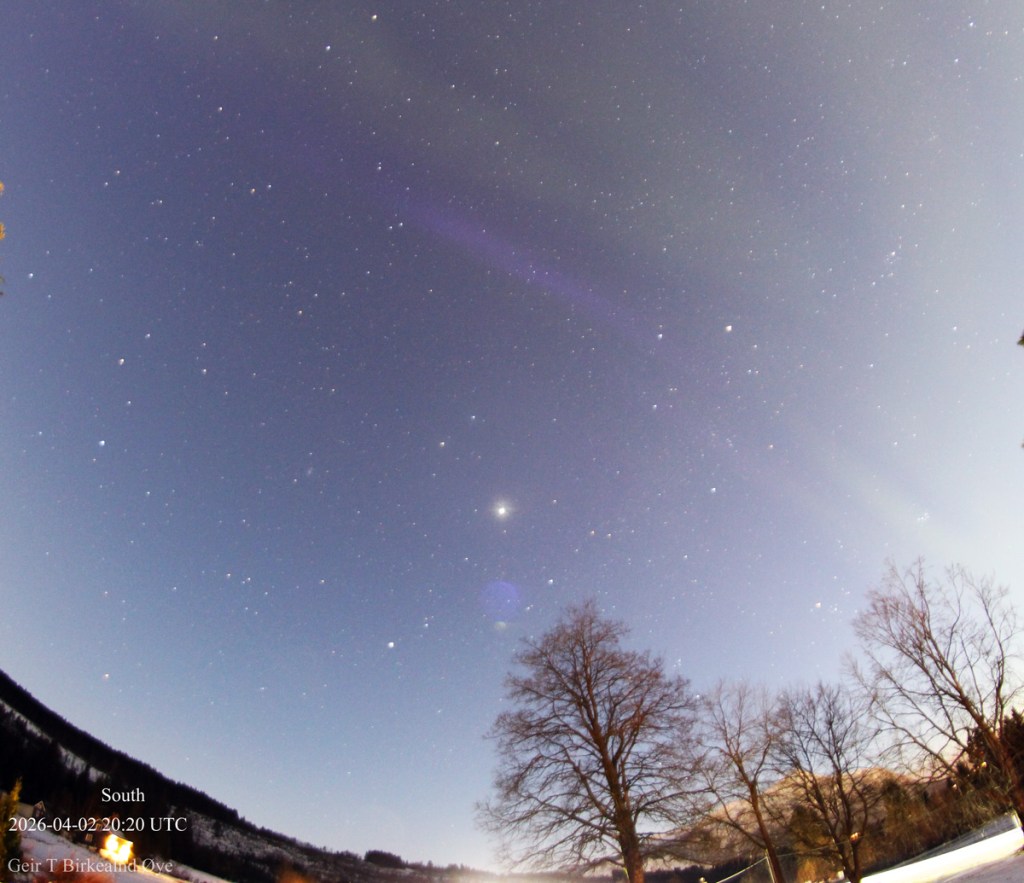
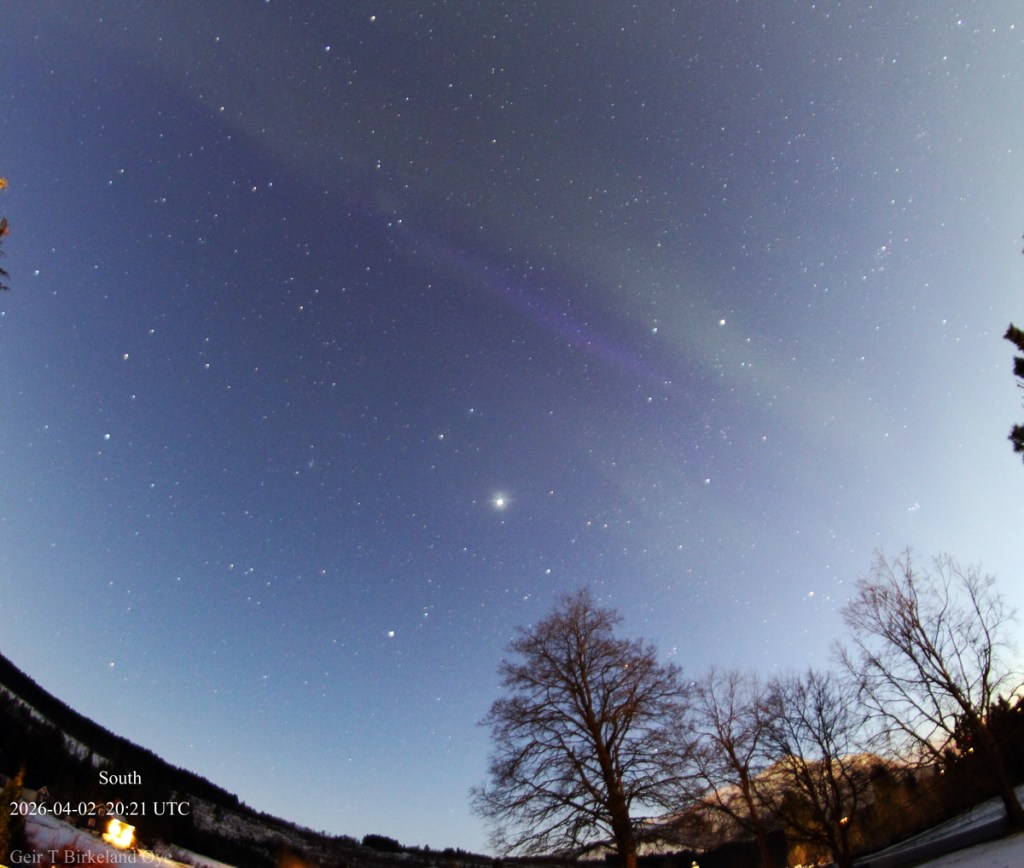
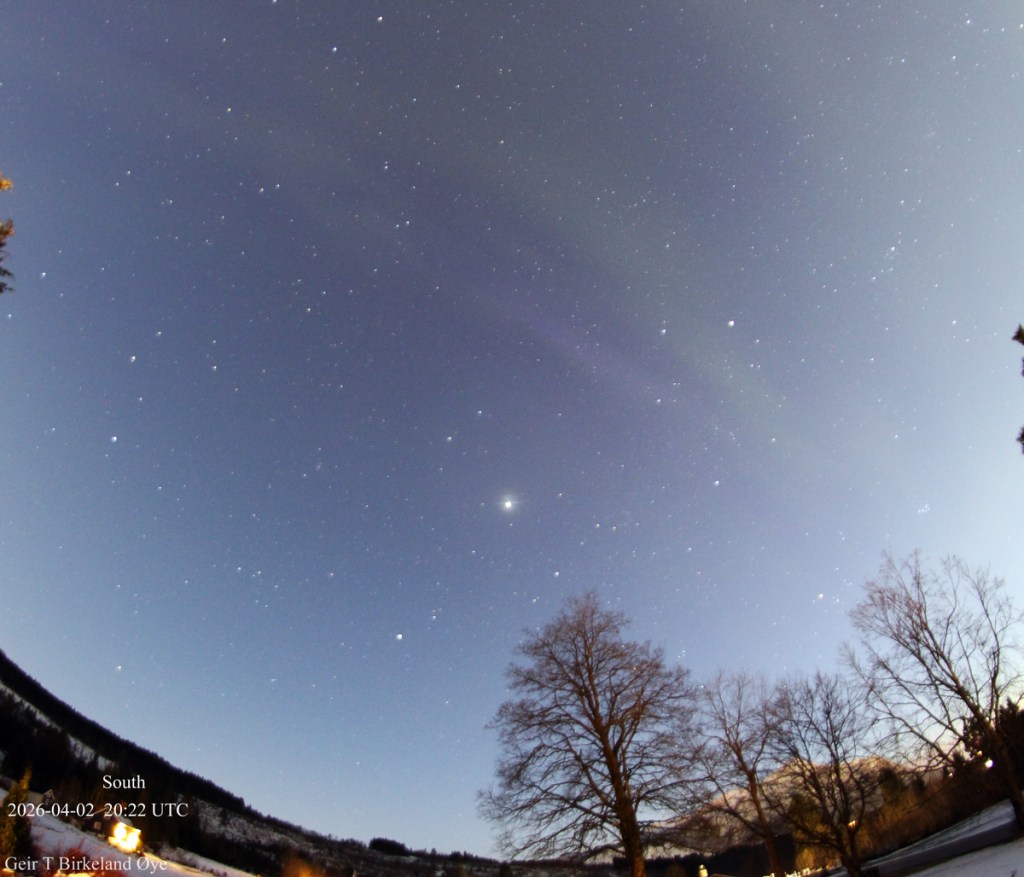
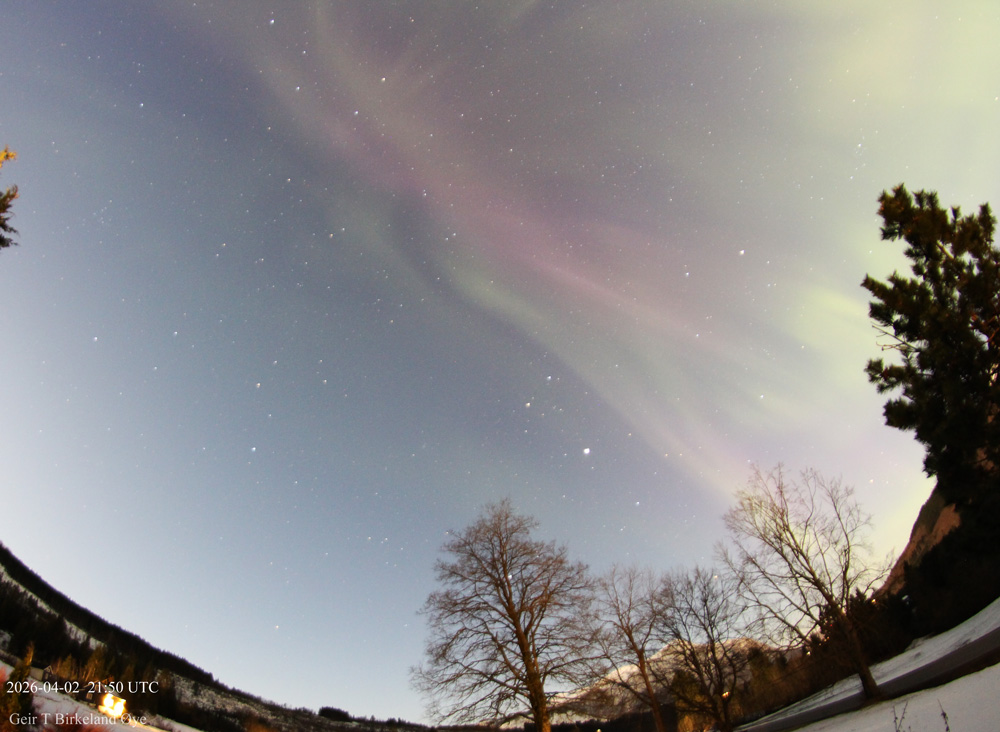
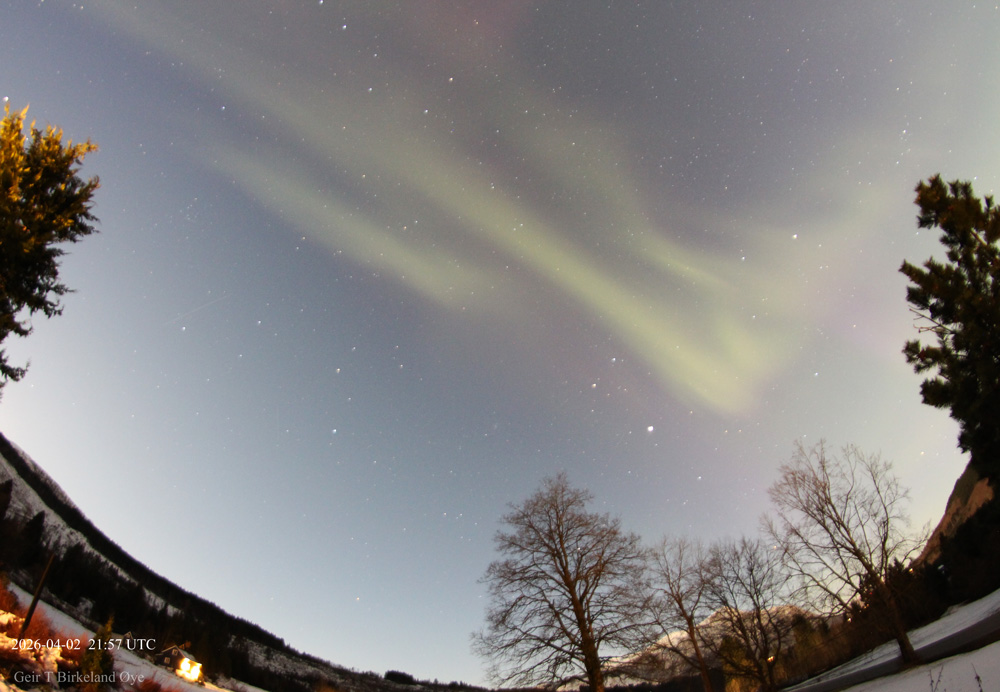
The auroras shone brightly enough to be visible in a sky dominated by the full Moon. Here are a few images from April 02 with timestamps in UTC. Details: Canon 650D, 8mm fisheye lens.